This is a hands-on walkthrough, not a slide deck. Every command below was run
on a single NVIDIA T4 (an AWS g4dn.xlarge, 15 GB, provisioned via
Brev), and every ▶ output block is the actual captured
output from that run. In six steps you go from nothing to a
load-driven, auto-scaling LLM endpoint on Kubernetes — and watch the
HorizontalPodAutoscaler add a replica live.
The full, reproducible source — setup scripts for k3s/GKE/EKS/bare-metal, NIM and Triton manifests, and the tuned T4 overlay behind every number here — is open source at codeberg.org/srinathv/llms_with_kubernetes. For the story and analysis behind these numbers, read the companion write-up Scale-Out Meets the Silicon Ceiling.
The box these labs ran on
Tesla T4 | 15360 MiB | driver 580.159.04 | compute capability 7.5
Ubuntu 22.04 | 4 vCPU | 15 GiB RAM | Docker + NVIDIA Container Toolkit 1.19
Two constraints from this hardware shape every step — keep them in mind:
- 15 GB VRAM → demo with a small model (
Qwen2.5-0.5B-Instruct). - Compute capability 7.5 (Turing) → no MIG, no hardware BF16, no FP8. We share the GPU with time-slicing, and serve in FP16.
Step 0 — Provision a T4
Goal: a running T4 cloud box you can ssh/exec into. ~3 min, ~US$0.53/hr.
Brev hands you a plain Ubuntu box with the NVIDIA driver + Container Toolkit already installed — exactly the substrate Kubernetes needs. (Any T4 VM works; only the provisioning commands differ.)
brev create demo-t4 --gpu-name T4        # or: brev start demo-t4
brev refresh                             # sync SSH config
brev exec demo-t4 "nvidia-smi --query-gpu=name,memory.total,driver_version,compute_cap --format=csv,noheader"
▶ output
Tesla T4, 15360 MiB, 580.159.04, 7.5
Two numbers to remember: 15360 MiB VRAM and compute capability 7.5. Everything downstream is shaped by them.
Step 1 — Kubernetes + the GPU
Goal: a single-node cluster that can schedule the T4. ~5 min.
We use k3s — a tiny, single-binary Kubernetes that bundles kubectl,
containerd, and a metrics-server (which the autoscaler in Step 3 needs).
curl -sfL https://get.k3s.io | sh -s - --write-kubeconfig-mode 644
export KUBECONFIG=/etc/rancher/k3s/k3s.yaml
k3s's default runtime is plain runc, which cannot see the GPU. Create a
RuntimeClass so pods can opt into the NVIDIA container runtime:
kubectl apply -f - <<'EOF'
apiVersion: node.k8s.io/v1
kind: RuntimeClass
metadata: { name: nvidia }
handler: nvidia
EOF
Install the NVIDIA device plugin (it teaches Kubernetes the nvidia.com/gpu
resource), then patch it onto the nvidia runtime — otherwise it boots under
runc and reports No devices found:
kubectl apply -f https://raw.githubusercontent.com/NVIDIA/k8s-device-plugin/v0.16.2/deployments/static/nvidia-device-plugin.yml
kubectl -n kube-system patch ds nvidia-device-plugin-daemonset --type merge \
  -p '{"spec":{"template":{"spec":{"runtimeClassName":"nvidia"}}}}'
kubectl -n kube-system rollout status ds/nvidia-device-plugin-daemonset
On a managed cluster (GKE/EKS) or with the full GPU Operator, the nvidia runtime is the default and this patch is unnecessary. k3s makes the moving part visible, which is good for learning.
Prove a pod can reach the GPU with a one-shot nvidia-smi:
kubectl apply -f - <<'EOF'
apiVersion: v1
kind: Pod
metadata: { name: gpu-smoke }
spec:
  runtimeClassName: nvidia
  restartPolicy: Never
  containers:
    - name: smoke
      image: nvidia/cuda:12.4.1-base-ubuntu22.04
      command: ['nvidia-smi','--query-gpu=name,memory.total,driver_version,compute_cap','--format=csv,noheader']
      resources: { limits: { nvidia.com/gpu: '1' } }
EOF
kubectl wait --for=jsonpath='{.status.phase}'=Succeeded pod/gpu-smoke --timeout=120s
kubectl logs gpu-smoke
▶ output — Kubernetes scheduled a pod onto the T4 and ran nvidia-smi inside it
Tesla T4, 15360 MiB, 580.159.04, 7.5
🎉 You now have Kubernetes scheduling work onto a T4.
Step 2 — Serve an LLM
Goal: a running OpenAI-compatible endpoint, backed by the T4. ~5 min.
We deploy vLLM (vllm/vllm-openai). Every knob traces back to a T4 fact:
runtimeClassName: nvidia            # k3s default runtime is runc → must opt in
nodeSelector: { nvidia.com/gpu.product: Tesla-T4 }
args:
  - "--model=Qwen/Qwen2.5-0.5B-Instruct"  # open weights, ~1 GB FP16
  - "--dtype=half"                  # T4 has NO hardware BF16 → force FP16
  - "--max-model-len=2048"          # cap context so the KV cache fits
  - "--gpu-memory-utilization=0.30" # leave VRAM for a 2nd replica to share the T4
  - "--enforce-eager"               # skip CUDA-graph capture: faster start, less VRAM
  - "--swap-space=1"                # default 4 GiB CPU swap → too much host RAM
  - "--max-num-seqs=32"             # cap in-flight sequences → bounded host memory
The very first log line is the architecture showing through — the T4 has no hardware BF16, so vLLM silently down-casts:
▶ vLLM startup logs (real, from the T4)
WARNING config.py:1674] Casting torch.bfloat16 to torch.float16.
INFO gpu_executor.py:122] # GPU blocks: 7624, # CPU blocks: 21845
INFO gpu_executor.py:126] Maximum concurrency for 2048 tokens per request: 59.56x
INFO Application startup complete.  Uvicorn running on http://0.0.0.0:8000
Weights are <1 GB, leaving room for 7624 KV-cache blocks — that headroom is what we spend on extra replicas next. Query it:
kubectl -n llm port-forward svc/vllm-llm 8000:8000 &
curl -s localhost:8000/v1/chat/completions \
  -H 'Content-Type: application/json' \
  -d '{"model":"demo","messages":[{"role":"user","content":"In one sentence, what is Kubernetes?"}],"max_tokens":64}' \
  | jq -r '.choices[0].message.content'
▶ output — a real completion generated on the T4
Kubernetes is an open-source platform for deploying, managing, and scaling
applications using a declarative and self-healing approach.
A real bite we hit: with vLLM's default
--swap-space 4, each pod used ~7.4 GiB of host RAM — two replicas exhausted the 15 GiB node and crash-looped. Dropping swap to 1 GiB cut it to ~3 GiB/pod. On a small box, host memory bites before VRAM does.
Step 3 — Scale it out
Goal: drive load and watch Kubernetes add replicas automatically. ~10 min.
On one physical T4 we use time-slicing so more than one replica can be scheduled — the device plugin advertises N virtual GPUs that round-robin the one card. There is no memory isolation; that's why the model is small.
kubectl apply -f manifests/tutorial/time-slicing-config.yaml
# …patch the device plugin to load it, then:
kubectl get node -o custom-columns='NODE:.metadata.name,GPU:.status.allocatable.nvidia\.com/gpu'
▶ output — one T4 now presents as 4 schedulable GPUs
NODE             GPU
brev-7r2zyfx21   4
Attach a HorizontalPodAutoscaler (scaling on CPU, 1→2 replicas), then drive 24 concurrent clients at the endpoint:
kubectl apply -f manifests/tutorial/vllm-hpa.yaml
BASE_URL=http://localhost:8000 CONCURRENCY=24 DURATION=160 \
  jupyter nbconvert --to notebook --execute load/scaleout_demo.ipynb
▶ the HPA's own decision log (kubectl describe hpa vllm-llm) — the full loop
SuccessfulRescale  New size: 2; reason: cpu resource utilization above target
SuccessfulRescale  New size: 1; reason: All metrics below target
Load rose, the HPA crossed its 50% target at ~59 s, a second pod passed its readiness probe and joined the Service, then was retired when load stopped. The control loop is flawless.
Why cap at
maxReplicas: 2? We measured it: 3 vLLM pods at ~1 core each, on a 4-vCPU box, starved the k3s control plane —kubectlcalls timed out. The autoscaler is a workload too; right-size it to the node.
Step 4 — See it, honestly
Goal: one chart — tokens/sec vs. ready replicas over time.
The notebook (load/scaleout_demo.ipynb)
samples cumulative tokens/sec and ready-replica count once a second and plots both:
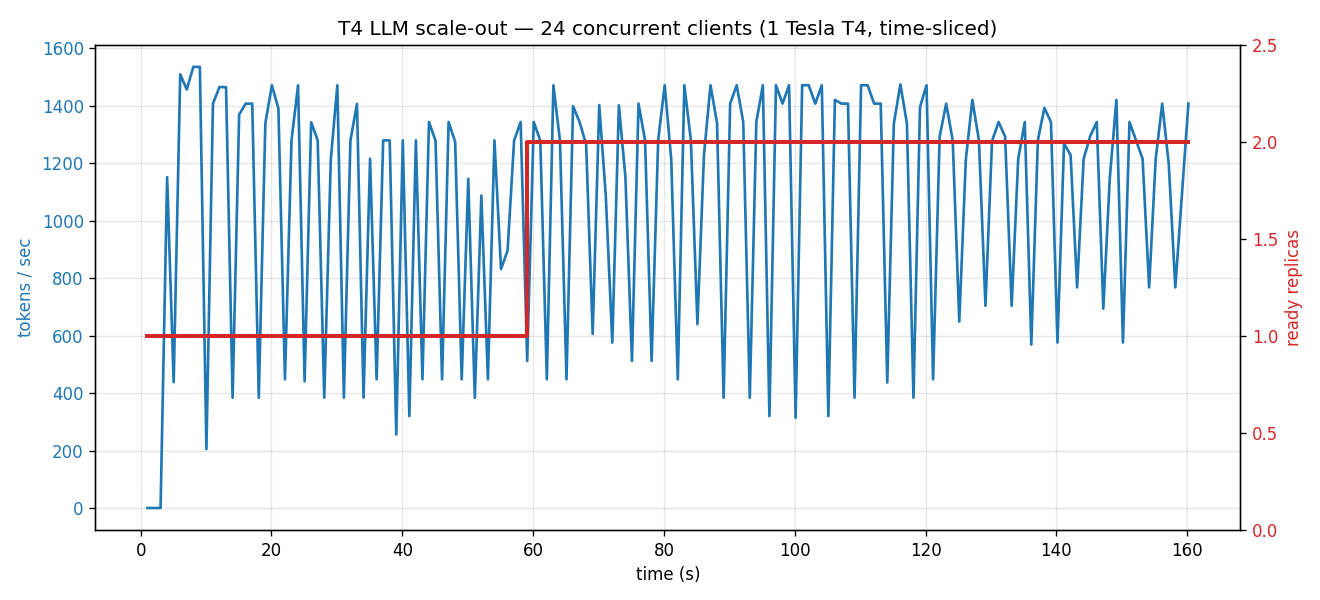
Read the chart honestly. The red line steps 1 → 2 at ~59 s — the HPA mechanics work perfectly. But the blue throughput stays in the same band. That is the time-slicing truth: both replicas share one physical T4, so you've added request-scheduling concurrency, not GPU FLOPs — the silicon is the ceiling.
Scale-out is not scale-up. To actually raise aggregate tokens/sec you need replicas on separate GPUs — a multi-GPU node, or the cloud path where the cluster autoscaler adds T4 nodes. Same HPA loop, real hardware underneath. Time-slicing is for packing (several light endpoints on one card), not for scaling.
Step 5 — Teardown
Goal: stop paying. A forgotten GPU box is the #1 way to burn cloud credit.
kubectl delete ns llm               # remove the workload, keep the cluster
/usr/local/bin/k3s-uninstall.sh     # remove k3s, keep the box
brev stop demo-t4                   # stop the instance (fast restart later)
brev delete demo-t4                 # …or delete it to stop all charges
Rule of thumb:
stopif you'll come back this week,deleteif you're done. Verify withbrev ls— never leave a T4 running idle.
Where to go next
- Run it yourself: clone
codeberg.org/srinathv/llms_with_kubernetes
and follow the
docs/tutorials/labs — the one-shot path isscripts/brev-demo.sh. - Read the analysis: Scale-Out Meets the Silicon Ceiling is the narrative behind these numbers, with the two-level control loop and three production gotchas in full.
- Standing up LLM inference on Kubernetes? Choosing between time-slicing, MIG, and whole-GPU replicas; deciding what metric to autoscale on; or debugging a crash-looping serving pod on budget hardware — this is work we do.
Going deeper
- Containerization from Clusters to Data Centers — the considerations behind the container runtime, isolation, GPU-sharing, and fabric choices these labs sit on, with diagrams of the VM-vs-container and hypervisor models.