From scaling up to scaling out
In the previous post we filled a single GPU. Continuous batching supplied the memory-level parallelism that turned an idle T4 into a 1855 tokens/sec server — a 27x throughput climb on unchanged hardware. That is scaling up: extracting more from one accelerator.
But a single GPU has a ceiling. Past it — more concurrent users than one card can serve within a latency budget, or a workload that simply needs more aggregate tokens/sec — you stop asking one GPU for more and start asking for more GPUs. That is scaling out, and it is an orchestration problem, not a kernel problem. The question becomes: who watches the load, decides another replica is needed, places it on a GPU, and routes traffic to it — automatically, at 3 a.m., without a human?
That is what Kubernetes does. This post builds the entire scale-out stack on the same modest T4 we have used throughout, and measures the control loop end to end. The full, reproducible repository — setup scripts for k3s/GKE/EKS/bare-metal, NIM and Triton manifests, and the hands-on T4 tutorials behind every number here — is open source at codeberg.org/srinathv/llms_with_kubernetes.
The two-level control loop
Kubernetes scale-out for GPU inference is two nested feedback loops, and keeping them straight is most of the battle:
- Pods, via the HorizontalPodAutoscaler (HPA). The HPA watches a metric and edits a Deployment's replica count. More load → more replicas of the model server, each holding a GPU, all behind one load-balanced Service.
- Nodes, via the Cluster Autoscaler. When the HPA wants a replica but no GPU is free, the new pod sits
Pending. On a cloud cluster that unschedulable pod is the exact signal that provisions another GPU node; when load drains, the node is removed.
 load ↑ → HPA adds pods → pod Pending (no free GPU) → autoscaler adds GPU node → pod runs
 load ↓ → HPA removes pods → node idle → autoscaler removes node
The HPA is the inner loop and the focus here; the cluster autoscaler is the outer loop that turns "I want more replicas" into "there is more silicon to run them on." On a single-box demo there is no outer loop — which, as we will see, is precisely where the honest lesson lives.
Setup — the whole GPU stack on one T4
Every layer Kubernetes needs to schedule a GPU was stood up on a single NVIDIA T4 (16 GB, Turing/sm_75) on an AWS g4dn.xlarge — 4 vCPU, 15 GiB RAM — the same deliberately-cheap target as before. The stack, bottom to top:
- k3s — a single-binary Kubernetes, with its bundled containerd and metrics-server.
- NVIDIA device plugin — teaches Kubernetes the
nvidia.com/gpuresource so pods can request a GPU. (On k3s this needs aRuntimeClasspointing at the NVIDIA container runtime; the cluster's defaultrunccannot see the GPU — the first of several moving parts the managed clouds hide.) - Time-slicing — the T4 is Turing, so it has no MIG (Multi-Instance GPU is an A100/H100 feature). To schedule more than one pod onto the one card, the device plugin advertises virtual GPUs that round-robin the real one. There is no memory isolation — every replica shares the same 16 GB.
- vLLM serving
Qwen2.5-0.5B-Instructin FP16 — small on purpose, so multiple replicas fit. - A HorizontalPodAutoscaler scaling on CPU between 1 and 2 replicas.
A GPU smoke-test pod ran nvidia-smi from inside the cluster to confirm Kubernetes was really scheduling onto the T4 before any model was deployed. Then load went in.
Result — the autoscaler works
Twenty-four concurrent clients drove the endpoint for 160 seconds while a sampler recorded tokens/sec and ready-replica count once a second. The HPA's own decision log tells the story cleanly:
SuccessfulRescale  New size: 2; reason: cpu resource utilization above target
SuccessfulRescale  New size: 1; reason: All metrics below target
| time | tokens/sec | ready replicas | event |
|---|---|---|---|
| 25 s | 441 | 1 | one replica under load |
| 55 s | 832 | 1 | CPU crosses the 50% target |
| 59 s | 512 | 2 | HPA adds a replica; new pod joins the Service |
| 120 s | 1472 | 2 | both replicas serving |
| 160 s | 1408 | 2 | steady state |
| after load | 0 | 1 | scaled back down (all metrics below target) |
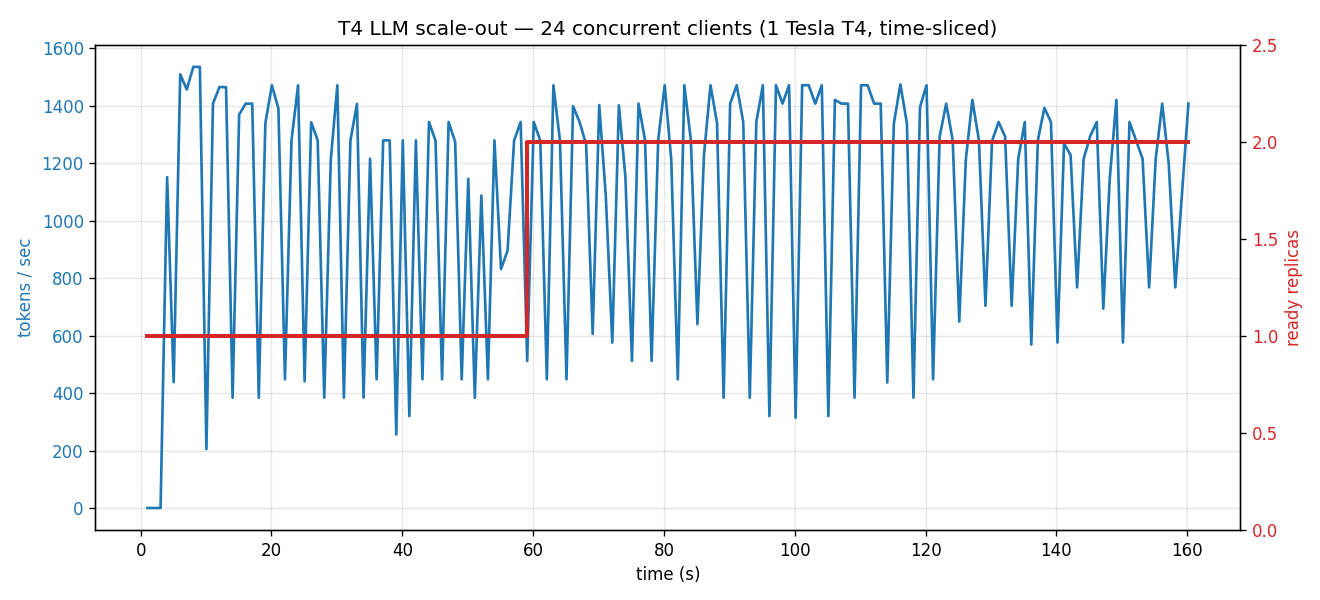
The control loop is flawless: load rose, the HPA crossed its target, a second pod was created, passed its readiness probe, joined the load-balanced Service, and was retired when the load stopped. If the metric had been GPU queue depth instead of CPU, or the cluster had a node autoscaler, the exact same loop would have provisioned hardware. The orchestration is real, and it is automatic.
The catch — scale-out is not scale-up
Now read the chart honestly. The replica line steps from 1 to 2, but the throughput line does not. Aggregate tokens/sec stays in the same band after the second replica joins as before it.
This is the time-slicing truth, and it is the whole point of running the experiment on one physical card. Both replicas are scheduled onto the same T4. Time-slicing gives them alternating turns at the silicon; it does not conjure a second silicon. We added a scheduling slot and request concurrency — not GPU FLOPs. The card was already the bottleneck at one replica, so a second replica sharing it cannot raise the aggregate throughput. The 16 GB and the tensor cores are a fixed pie; we cut it into two slices.
This is the orchestration-layer echo of the lesson from the batching post. There, one decode stream could not saturate the GPU's bandwidth, and parallelism (batching) was the fix. Here, the GPU is saturated, and the only way to raise aggregate throughput is more GPUs — replicas on separate cards. The HPA loop demonstrated on this one T4 is exactly the loop that, pointed at a multi-GPU node or a cloud GPU node-pool, does multiply throughput: same control plane, real hardware underneath. The single-T4 lab proves the mechanism; the cloud spends it on silicon.
The practical rule: time-slicing is for packing, not for scaling. Use it to host several light, bursty, low-QPS endpoints on one card, or for dev and demos. Do not reach for it expecting throughput — for that you need the cluster autoscaler handing the HPA real, separate GPUs.
Three production bites, free of charge
As with the FlashInfer/Turing kernel crash last time, the obstacles were where the real knowledge was. Three are worth recording, because each is invisible on an A100 and a lost afternoon on a T4.
1. The BF16 cast — the architecture showing through the logs. vLLM's first words on startup:
WARNING Casting torch.bfloat16 to torch.float16.
The model's config requests BF16; the T4 (sm_75) has no hardware BF16 — that arrived with Ampere. The engine silently down-casts to FP16. Harmless here, but the same gap is a hard failure for code that assumes BF16 numerics. The hardware's generation is right there in the first log line if you know to read it.
2. Host RAM exhausts before VRAM. The first attempt to scale to a second replica crash-looped the node. The cause was not the GPU — it was system memory. vLLM reserves a CPU-side KV-cache swap space (4 GiB by default), and each pod's true host footprint was ~7.4 GiB. Two of them exceeded the 15 GiB box and the kernel started killing processes. Dropping --swap-space to 1 GiB cut each pod to ~3 GiB, and two fit comfortably. On a small node, host memory is the binding constraint, and it bites before anything you were watching on the GPU.
3. A 4-vCPU control plane starves under its own workload. An earlier run let the HPA scale to three replicas. Three vLLM pods at roughly one core each, on a 4-vCPU box, starved the k3s control plane itself — kubectl calls began timing out, and the autoscaler's own metrics pipeline went blind mid-test. The fix was to right-size the autoscaler to the node: cap maxReplicas at 2 so the API server keeps a core to breathe. The autoscaler is a workload too, and on a small node it competes with what it is trying to schedule.
None of these are exotic. They are the ordinary texture of running real serving software on real, budget-constrained hardware — exactly the conditions a slide deck omits and a deployment cannot.
Caveats
- One small model, one small GPU, single node. The mechanism — HPA loop, time-slicing semantics, the host-memory and control-plane limits — is what generalizes; absolute numbers do not.
- CPU was the scaling metric. It is zero-setup and enough to demonstrate the loop, but it is a proxy. Production LLM autoscaling should scale on GPU utilization or request-queue depth (vLLM and Triton both export these); the repo wires up Prometheus + the metrics adapter for exactly this, held for a follow-up.
- No outer loop on one box. The genuine throughput-multiplying behavior — cluster autoscaler adding GPU nodes — is asserted from the manifests, not measured here. Demonstrating it on a multi-node GPU pool is the obvious next step.
- Time-slicing, not MIG or whole-GPU replicas. On Ampere+ the same Deployment with MIG, or with one whole GPU per replica across a node pool, changes the throughput story entirely — that is the point.
Where this goes
This is the orchestration layer of the LLM-systems line of work. The batching post measured one engine on one GPU; this one wraps that engine in the control plane that runs it at scale. Planned next: scale on queue depth instead of CPU and attribute the difference; run the identical HPA loop across a multi-GPU node pool to measure the real throughput multiplication the single-T4 lab could only assert; compare NVIDIA NIM and Triton as the served stack (the repo carries manifests for both); and add KEDA scale-to-zero for the bursty, cost-sensitive case where idle GPUs are pure waste.
If your team is standing up LLM inference on Kubernetes — choosing between time-slicing, MIG, and whole-GPU replicas; deciding what metric to autoscale on; or debugging why a serving pod crash-loops on the hardware your budget actually allows — this is work we do.
References
- NVIDIA. "GPU Operator" and "k8s-device-plugin" documentation. github.com/NVIDIA/k8s-device-plugin
- Kubernetes. "Horizontal Pod Autoscaling." kubernetes.io/docs/tasks/run-application/horizontal-pod-autoscale
- NVIDIA. "Time-Slicing GPUs in Kubernetes." docs.nvidia.com/datacenter/cloud-native
- W. Kwon, Z. Li, S. Zhuang, et al. "Efficient Memory Management for Large Language Model Serving with PagedAttention." SOSP 2023. arxiv.org/abs/2309.06180