The challenge
PENNANT is a Lagrangian hydrodynamics mini-app on unstructured meshes — a proxy for production multiphysics codes, and part of the CORAL-2 suite that vetted El Capitan, the ~2-exaflop machine at Lawrence Livermore. I chose it not to re-run anyone's procurement, but because it is a deliberately hard GPU target — the worst case is the best test of a methodology. Its mesh is sides-indexed: the side is the fundamental loop body, each side reaching two points, one zone, and two edges through indirection maps. That structure produces exactly the access pattern GPUs are worst at:
- Scatter writes are unavoidable. Many sides map to the same zone, so every
zone reduction (viscosity, work, normalization) must
atomicAddfrom sides to zones. There is no contiguous store. - Low arithmetic intensity. The hydro sweep moves a lot of bytes per FLOP, placing it deep in memory-bound territory on the roofline.
- Hidden host/device traffic. Side forces computed on the host round-trip to the GPU every cycle — tens of MB per cycle that can erase any GPU win if left unaddressed.
This is an independent, self-funded exploration with a deliberate goal: to establish a reusable, platform-agnostic performance methodology, not to reproduce a vendor's acceptance run. I ported the benchmark to the GPU from a clean-room, BSD-3 implementation on rentable cloud GPUs — NVIDIA T4 and H100 via Brev, AMD MI300X via Hot Aisle — so the method is demonstrated across two vendors, from a single codebase, on hardware any team can actually rent. The point was rigor that travels: roofline-driven, correctness-gated, and honest about where the GPU does and does not win. It then went one step further than a port: an optimization campaign — launch-configuration tuning, hybrid CPU/GPU dispatch, and compiler-flag sweeps — with the measurement discipline to know when a knob does nothing and when a speedup is an artifact.
A note on hardware, since it is easy to conflate: El Capitan's production silicon is the AMD MI300A — an APU with CPU and GPU on shared HBM. The rentable part is the MI300X, the discrete datacenter sibling in the same CDNA 3 (gfx942) family. This study ran on the MI300X plus two generations of discrete NVIDIA hardware; the unified-memory advantage of the El Cap APU is therefore not part of these numbers, which makes the cross-vendor bandwidth scaling below a cleaner comparison rather than a muddier one.
The approach
The port ran in six phases, each justified by Nsight Compute roofline data — DRAM throughput and IPC per kernel, measured before and after every change. No blind optimization. The loop was always the same: build → 7/7 correctness regression against the LANL reference → profile → read the roofline → change one thing → re-measure.
The diagnostic rule that drove every decision:
Both DRAM% and IPC low → launch-configuration bug (not enough work in flight). DRAM% high, IPC low → memory-bound but correctly scheduled (this is where most of PENNANT lives). Both rising → climbing the roofline.
Kernel selection followed roofline logic, not the conventional "port the biggest time-consumer first." The kernels worth moving to the GPU are the low-arithmetic-intensity, memory-bound ones — they sit far below the compute ceiling on the CPU precisely because they are starved for bandwidth, and HBM is exactly the resource the GPU adds.
What we found
The biggest single win was a launch-configuration change — and it doesn't transfer between vendors
The first naive port launched a 4-block grid on a 40-SM T4 — the warp scheduler sat 97% idle. Switching to persistent device buffers and dispatching the whole array per launch (grid = ~4,100 blocks) moved one representative kernel as follows, with no change to the kernel math at all:
| Metric | Before | After |
|---|---|---|
| Grid size | 4 blocks | 4,102 blocks |
| DRAM throughput | 2.7% | 89% |
| Warp occupancy | 22% | 93% |
| Wall time (medium mesh, CPU→GPU) | 126 s | 65.7 s |
IPC barely moved (0.10 → 0.12) even as occupancy hit 93% — the signature of a genuinely bandwidth-bound kernel. At 89% of the T4's 300 GB/s HBM2 peak, it was as close to the roof as practical. The lesson generalizes: the kernel was always correct; it was simply never given enough work per launch.
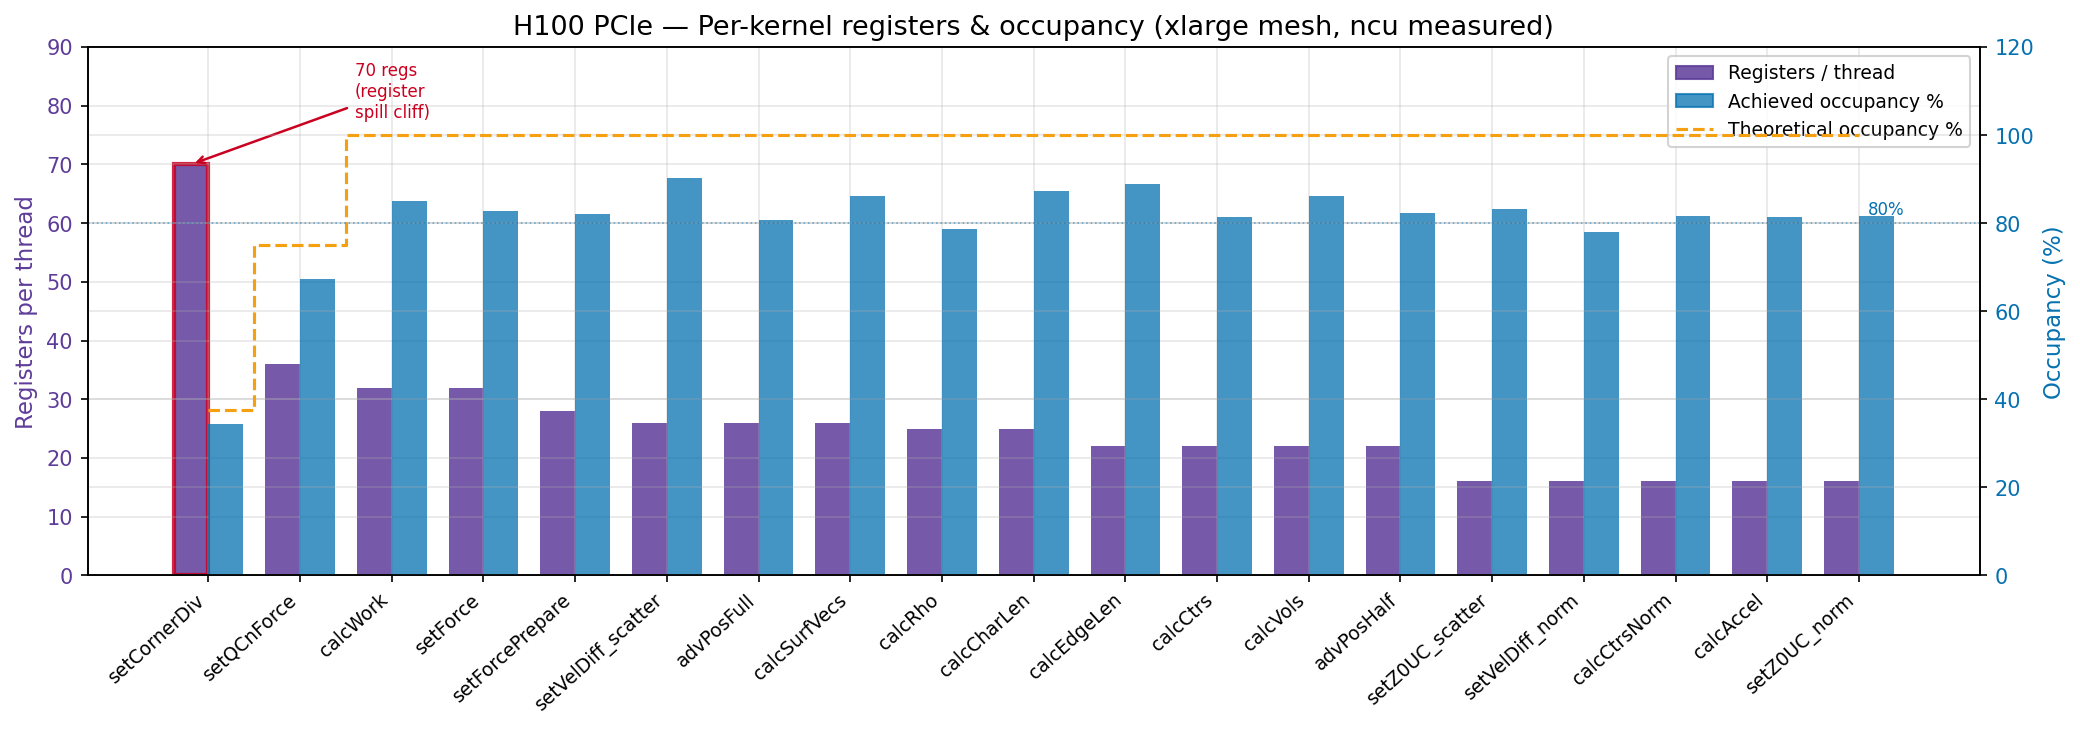
The catch that makes it a capability result, not a tip: the right launch
configuration is per architecture. On the H100, the heaviest kernel
(setCornerDiv) is occupancy-limited at 34%; on the MI300X — whose CDNA-3
register file is twice as large — the same source hits 100% occupancy with no
spills, and the occupancy levers that help the H100 do nothing. You cannot copy a
launch-bounds tuning between vendors.
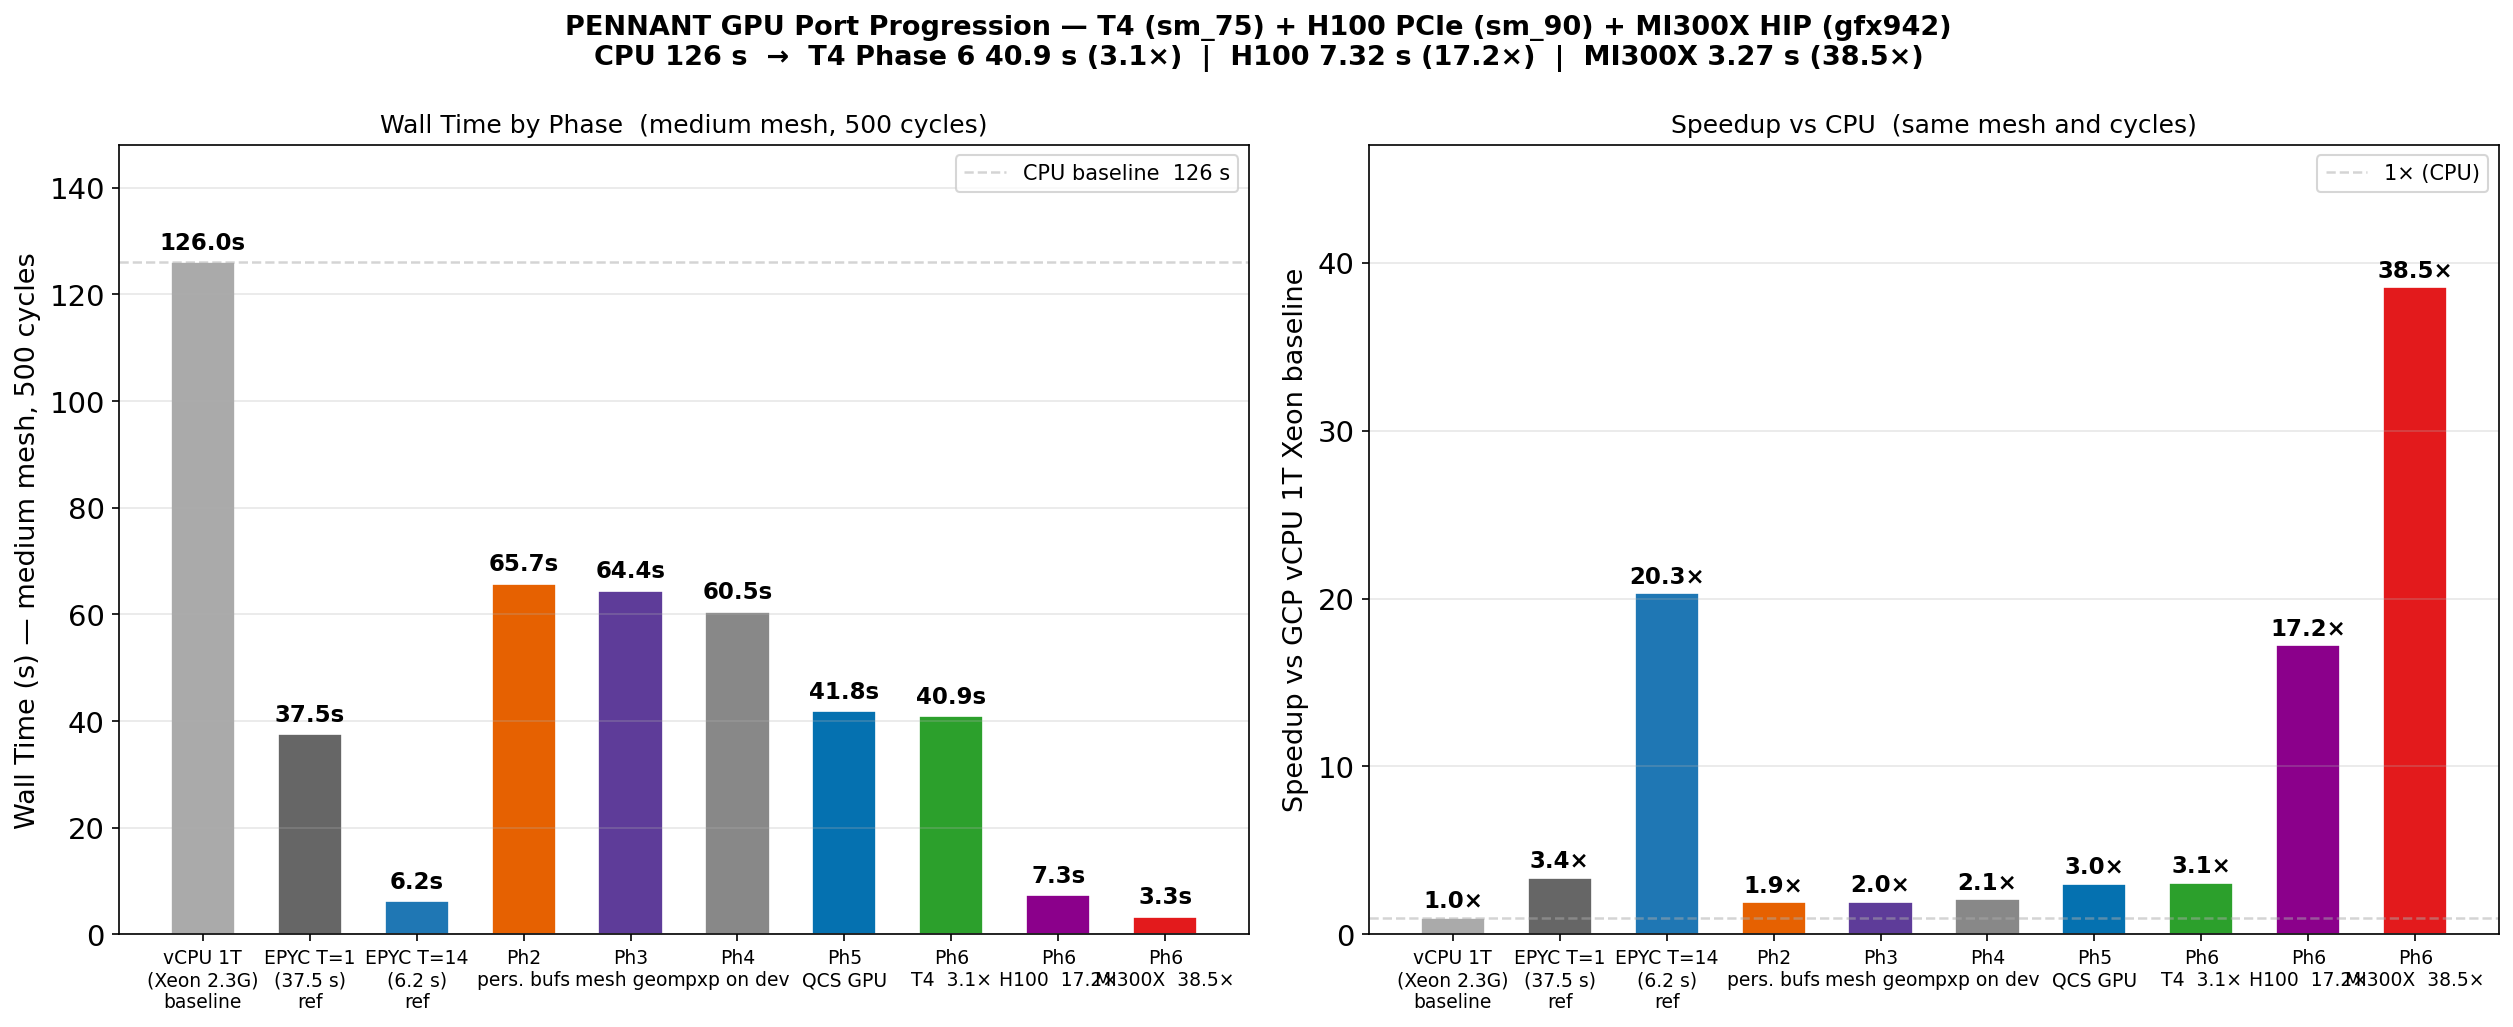
The full six-phase progression (T4, sm_75)
| Phase | What changed | Wall time | Speedup |
|---|---|---|---|
| CPU baseline | 1-thread | 126 s | 1× |
| 1 | First kernels on GPU (grid=4, 97% idle) | ~200 s | <1× |
| 2 | Persistent buffers, full-range dispatch | 65.7 s | 1.9× |
| 3 | Mesh geometry stages on GPU | 64.4 s | 2.0× |
| 4 | Keep predictor positions on device | 60.5 s | 2.1× |
| 5 | QCS force (8 kernels, atomic scatter) | 41.8 s | 3.0× |
| 6 + Option A | Edges-indexed fix + eliminate 24 MB/cycle of host↔device traffic | 40.9 s | 3.1× |
A recurring sub-lesson, from the edges-indexed fix in Phase 6: match the grid to the output granularity, not the input. Launching one thread per side for a per-edge write produced duplicate writes that serialized in L2; relaunching per edge halved the threads and doubled IPC with no atomics.
Hybrid CPU/GPU dispatch flips sign between vendors
Phase 7 added hybrid CPU/GPU dispatch — the option to route a zone-kernel
back to the host and overlap it with GPU work. Routing setVelDiff_norm to the
CPU is the preferred build on the H100 PCIe (−21%): the host computation hides
behind PCIe transfer. The identical flag is a regression on the MI300X (+1.3%,
and +12.3% if you route all four zone-kernels): the MI300X is HBM-saturated and
data-resident, so offloading only adds traffic.
| Config | H100 PCIe | MI300X |
|---|---|---|
SETVELDIFFNORM → CPU |
−21% (preferred) | +1.3% (avoid) |
| all four zone-kernels → CPU | mixed | +12.3% |
The deliverable is per-architecture defaults, archived directly in the build system. Generic "offload to overlap" advice would have been wrong on one of the two GPUs.
Knowing when not to flip a flag — two honest negatives
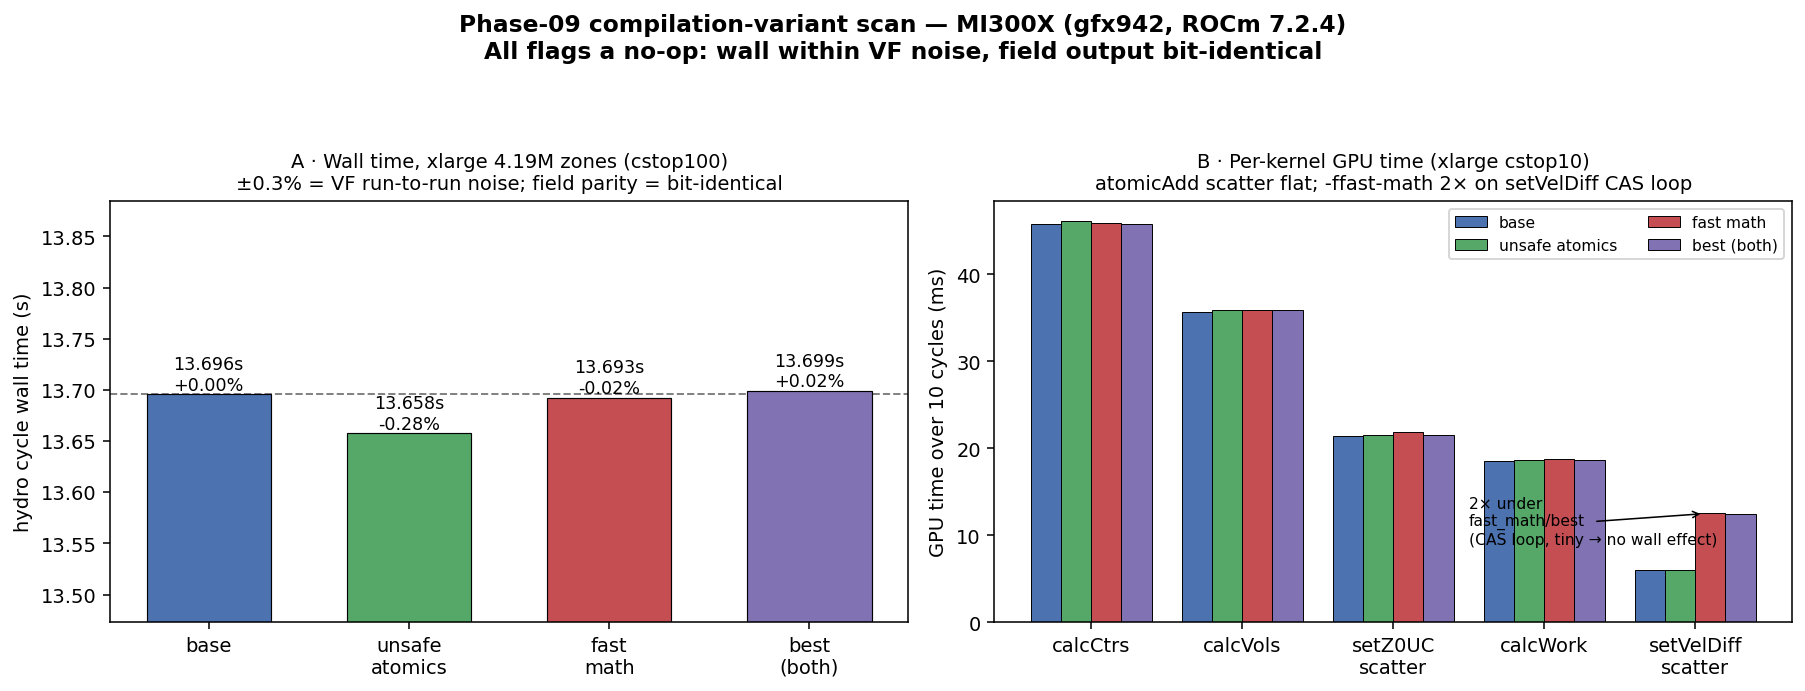
Phase 8 swept the compiler-flag axes that change device codegen without touching
kernel source: -ffast-math and (on AMD) -munsafe-fp-atomics.
MI300X — every flag a no-op, bit-identical output. The predicted "primary
lever," unsafe FP atomics, does nothing: ROCm 7.2.4 already lowers
atomicAdd(double) to the hardware global_atomic_add_f64 by default, so there
is no slow path to replace. Wall time within run-to-run noise; field output
bit-identical over 4.19 M zones. The ceiling was already reached by the safe
default — and a client is saved from shipping a placebo flag.
H100 — a 6.9% "win" that wasn't. A single sequential A/B showed -ffast-math
at −6.9%, bit-identical. Exciting — and wrong. The per-kernel trace showed the
GPU kernels were flat, so the wall-time win had no device source. A 7-rep
round-robin (interleaving the two builds so both see identical thermal state)
erased it: fast-math came out +3.6% slower. The −6.9% was a cold-base
phantom — the first run on a freshly-booted cloud box runs slow, and the
sequential A/B had compared a cold baseline against a warm variant.
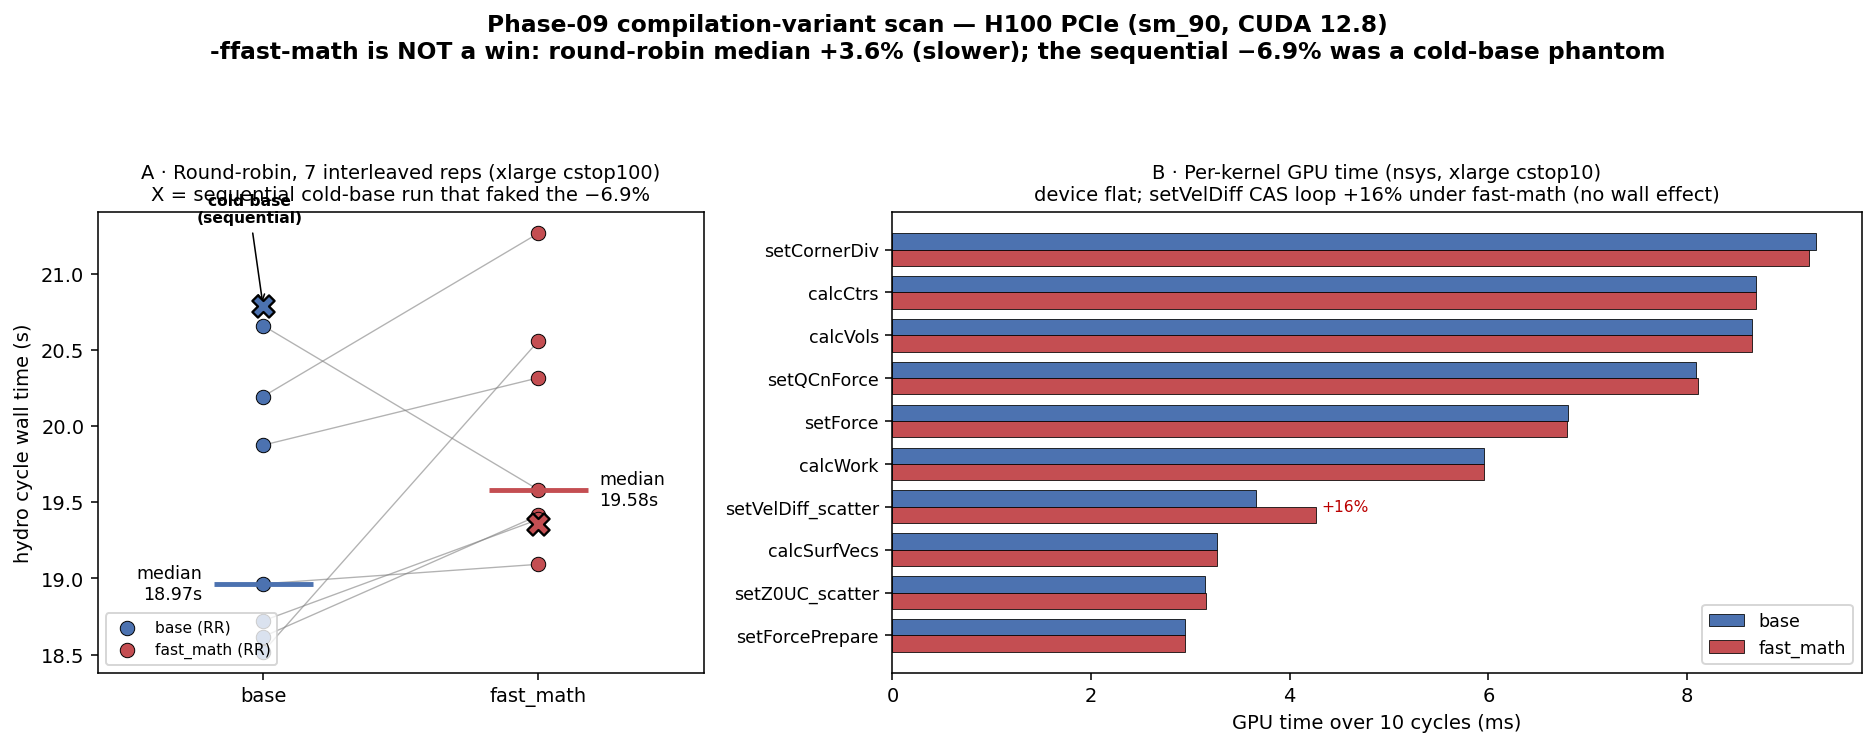
This is the part worth keeping. The phantom was large, directional, and survived a bit-identical correctness check — a physics gate cannot catch a measurement error. The tell was a wall-time delta with no matching device delta; the fix was three minutes of round-robin re-measurement. That instinct — distrust a clean number until it survives interleaved re-measurement — is the discipline a client is actually paying for.
Speedup tracked HBM bandwidth across three architectures — predictably
The same Phase 6 code, run unchanged on three GPUs (medium mesh, 500 cycles):
| GPU | HBM bandwidth | Wall time | Speedup vs 1-thread CPU |
|---|---|---|---|
| T4 (sm_75) | 300 GB/s (HBM2) | 40.9 s | 3.1× |
| H100 PCIe (sm_90) | 2.0 TB/s (HBM2e) | 7.32 s | 17.2× |
| MI300X (gfx942) | 5.3 TB/s (HBM3) | 3.27 s | 38.5× |
The H100/T4 wall-time ratio (40.9 / 7.32 = 5.6×) lands close to the HBM bandwidth ratio (2000/300 = 6.7×) — the H100 delivers about 84% of bandwidth-proportional scaling, the shortfall going to fixed overheads (kernel launch, and the residual host↔device traffic of a partial port) — and at production-relevant mesh sizes the whole hydro loop clustered at 83–93% DRAM throughput. For this kernel class, roofline is not just descriptive — it is predictive: it fixes the ceiling and the ordering, and the measured speedup lands just beneath it. One genuinely architecture-dependent surprise: the most FLOP-heavy QCS kernel read 15 arrays per thread and was latency-stalled on the T4 (IPC 0.13), but the H100's wider scheduler hid that dependency chain and lifted it to IPC 1.79 — same code, 13.8× the instruction throughput.
The whole campaign rests on one diagram. Plot every PENNANT kernel on the roofline — performance versus arithmetic intensity — and they all land far left of the ridge point, pinned to the sloped bandwidth ceiling, nowhere near the flat compute ceiling. That is the analytical reason every result above came out the way it did: the app is bandwidth-bound, so compute and occupancy levers (fast-math, launch bounds) cannot move it, and only reducing memory traffic can.
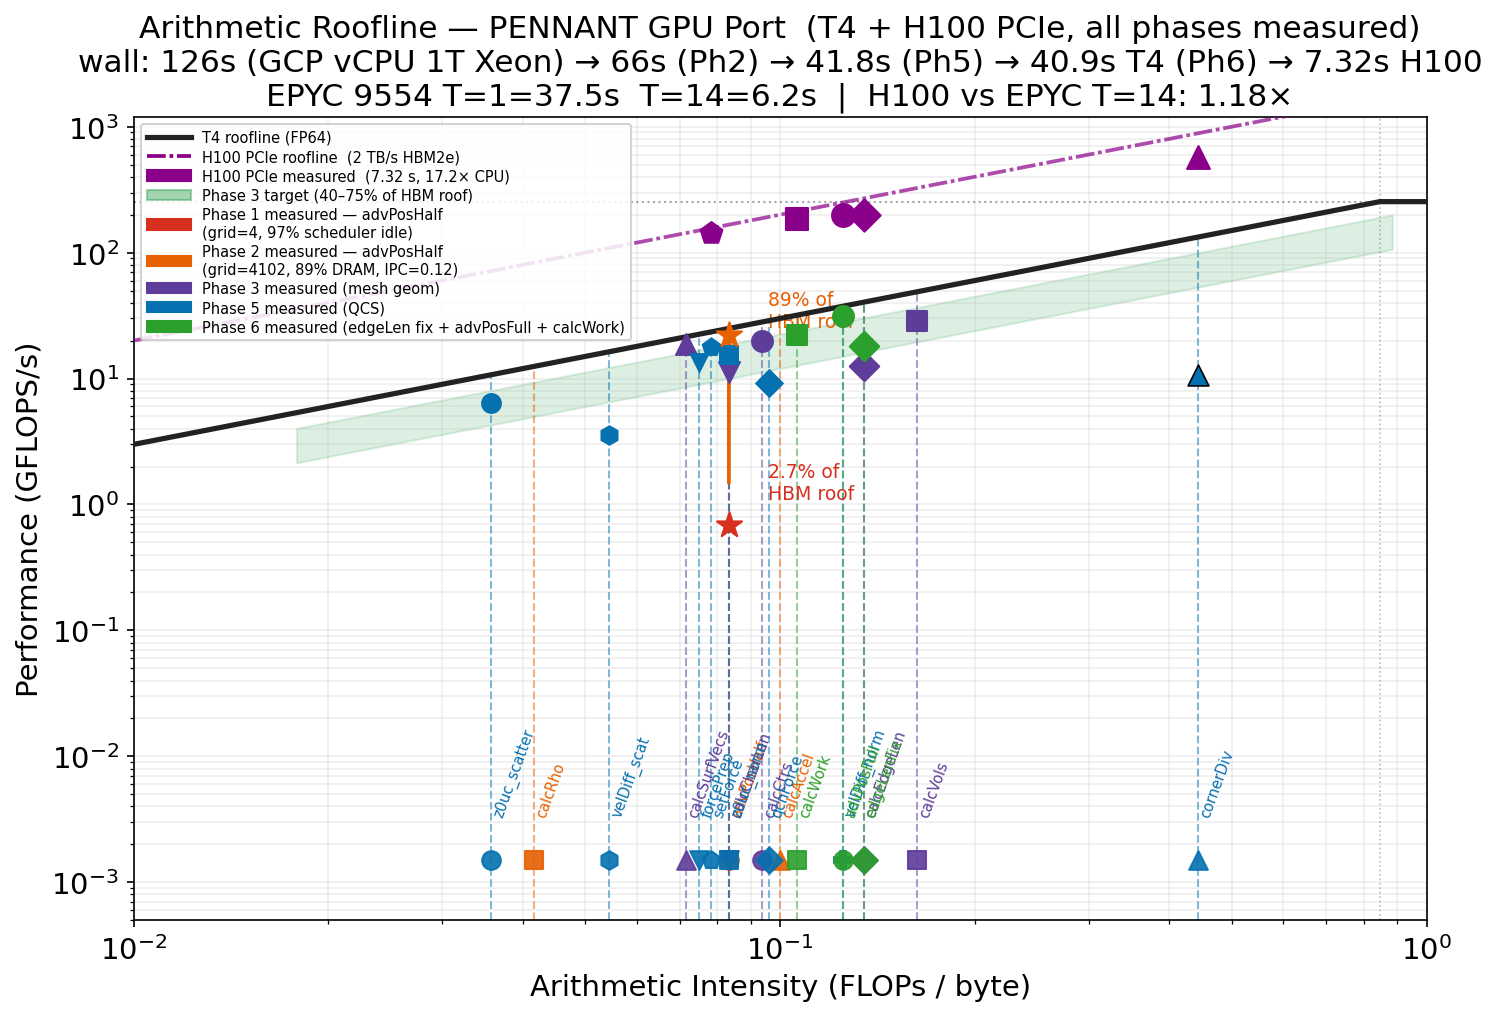
The same picture holds on AMD silicon — the MI300X kernels ride the HBM3 bandwidth ceiling (5.3 TB/s peak) exactly as the T4 and H100 kernels ride theirs. Because all three GPUs put PENNANT in the bandwidth-bound regime, the speedup is predictable from bandwidth — across T4 → H100 → MI300X the measured speedup rises with HBM bandwidth and lands at roughly 70–85% of bandwidth-proportional (H100 ~84%, MI300X ~70%), the gap widening on the faster silicon exactly as fixed per-launch and transfer overheads would predict — they eat a larger share once the compute itself gets cheap. The roofline was not a post-hoc diagram; it was a model that predicted the ceiling and the ordering each GPU would deliver, because the work to identify the binding constraint had been done first.
The honest part: the GPU does not always win
The 38.5× headline is measured against a 1-thread cloud-VM CPU. That is a real number, but it is not the number a buyer should plan on. Against a 14-core EPYC 9554 server at matched problem size, the picture is sober:
| Mesh size | H100 vs EPYC (14 threads) | Verdict |
|---|---|---|
| medium (261K zones) | 7.6 s vs 6.2 s | CPU wins |
| large (1.05M zones) | 24.9 s vs 23.0 s | CPU still wins, narrowly |
| xlarge (4.19M zones) | 88.3 s vs 103.7 s | GPU wins |
The crossover sits around ~2M zones for this problem. Below it, the GPU is overhead-limited and a good multi-core CPU is the right tool. This is the kind of result that only shows up when you benchmark against a competent baseline instead of a strawman — and it is exactly the result a client needs before spending on accelerators. (A second cautionary finding: a partial OpenMP-target offload of only the cheap kernels ran 38% slower than single-thread CPU, because the 60%-of-runtime viscosity stage stayed on the host. Partial offload is worse than none.)
Discussion: where the cycles actually go, and why overlap can't rescue it
A dedicated profiling pass on the MI300X (gfx942, ROCm 7.2.4) measured where the GPU's cycles actually go — two views, at two levels of the hierarchy, both pointing the same way.
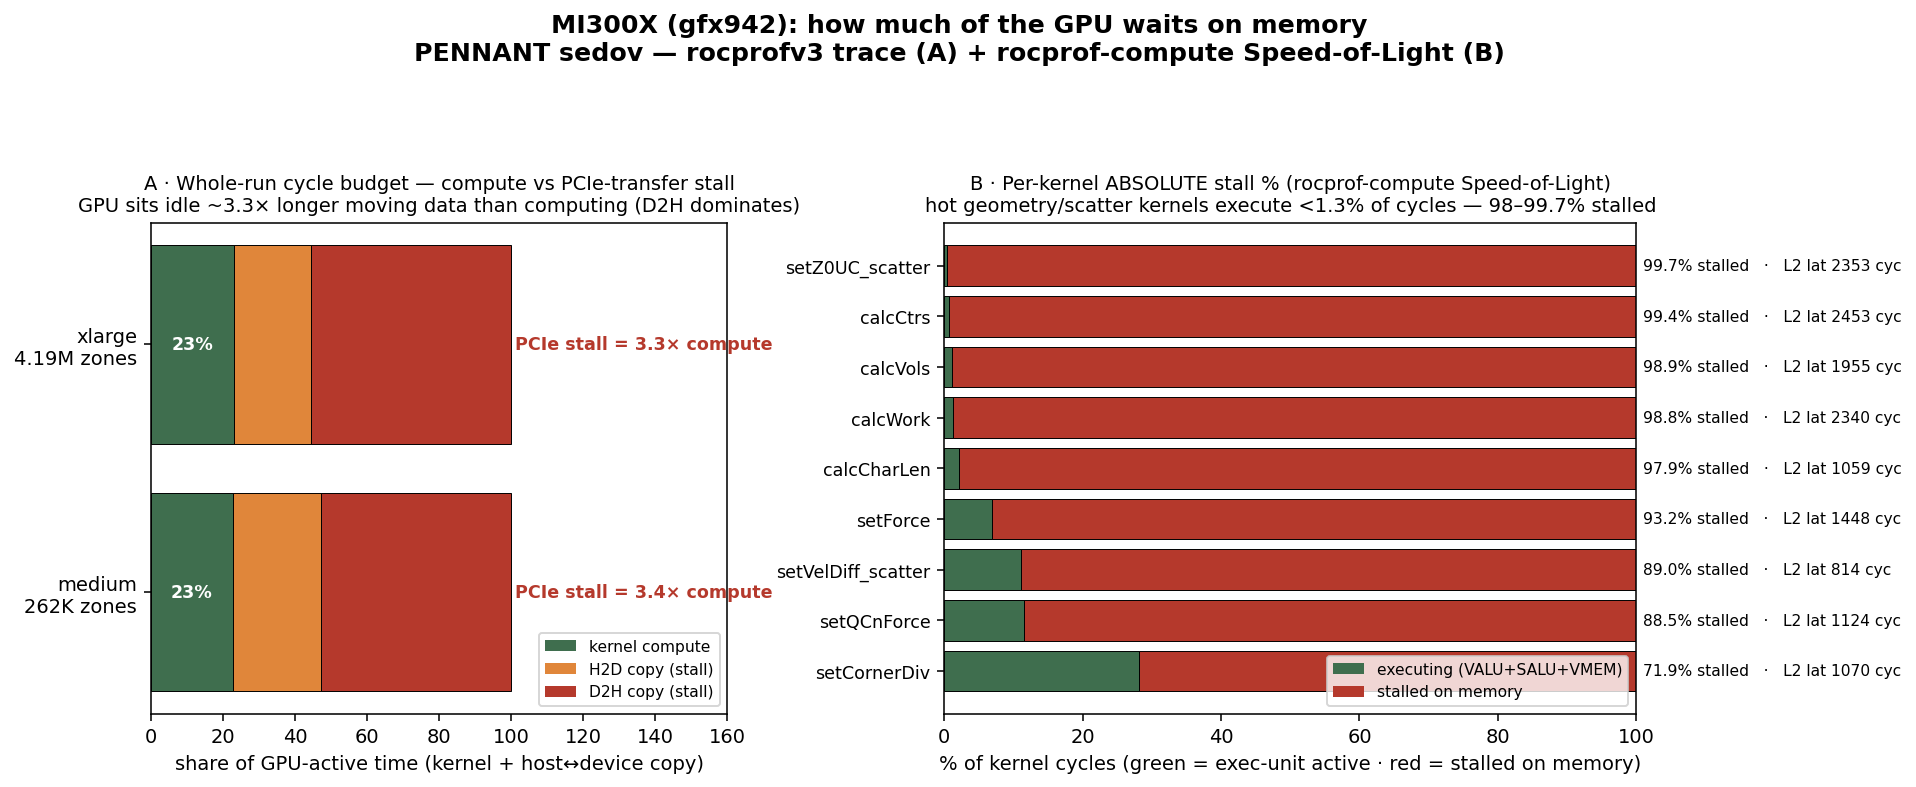
At the whole-run level, the GPU spends ~3.3× more cycles stalled on host↔device transfer than it spends executing kernels. Only 23% of GPU-active time is compute; the rest is PCIe-class copies — and because this is a partial port (dt control, energy, and boundary conditions are still CPU-resident), the device-to-host readbacks dominate (25 ms vs 12 ms host-to-device on the medium mesh). On a single stream every copy is 100% non-overlapped, so each one fully stalls the compute units. The penalty is mesh-invariant — kernels and transfers both move per-zone arrays, so a bigger mesh scales them together and never dilutes the ratio (medium 3.4×, xlarge 3.3×).
At the kernel level, even the compute that does run is mostly waiting. Under
rocprof-compute's normalized Speed-of-Light metrics, the hot geometry and scatter
kernels issue an instruction on fewer than 1.3% of cycles — they are 98–99.7%
stalled on memory — despite ~60% wavefront occupancy. The cause is an L2-fabric
read latency of ~2,000–2,450 cycles that the available occupancy cannot hide.
Even the one genuinely compute-bound kernel, setCornerDiv (the register-heavy
QCS kernel), still stalls ~72% of the time. This is the absolute confirmation of
the roofline: the runtime-dominating kernels are HBM-latency stall machines.
The same picture on NVIDIA (Nsight Compute)
This is not an AMD artifact. On the H100, NVIDIA Nsight Compute reaches the identical diagnosis through a different metric — Long Scoreboard stalls (warps waiting on a global / L1TEX memory dependency) dominate the hot kernels, and the schedulers are starved of anything ready to issue:
| kernel (H100) | Long-Scoreboard share of stall | eligible warps / cycle |
|---|---|---|
| setForce | 94% | 0.12 |
| advPosHalf | 93% | 0.08 |
| calcWork | 92% | 0.13 |
| calcVols | 86% | 0.16 |
setCornerDiv (compute-bound) |
50% | 0.72 |
For the memory-bound kernels, Long Scoreboard accounts for ~85–94% of the
average cycles between two issued instructions, and each scheduler finds only
0.08–0.16 eligible warps per cycle — it manages to issue roughly once every
13–19 cycles. Occupancy is not the problem (the warps are resident); they are all
simply waiting on memory. The lone compute-capable kernel is again setCornerDiv.
The cross-generation NVIDIA contrast sharpens it: the same source runs at IPC 0.13 on the T4 (heavily latency-stalled) and IPC 1.79 on the H100 — a 13.8× jump — because the H100's wider HBM2e bus and scheduler hide more of the latency. Yet even then no kernel approaches the FP64 compute ceiling; the H100 is faster only because it moves bytes faster, exactly as the roofline predicts. Whether AMD or NVIDIA, the kernels are memory-latency machines — which is why the overlap argument below holds on every platform.
Put the two vendors side by side and the per-kernel stall is near-identical —
a direct measure of how much of the compute fabric goes unused. Stall here is
the fraction of cycles the execution units issue nothing: on AMD, 100 −
(VALU+SALU+VMEM utilization); on NVIDIA, 100 − issue-slot utilization — the
same quantity reached through each vendor's native counters.
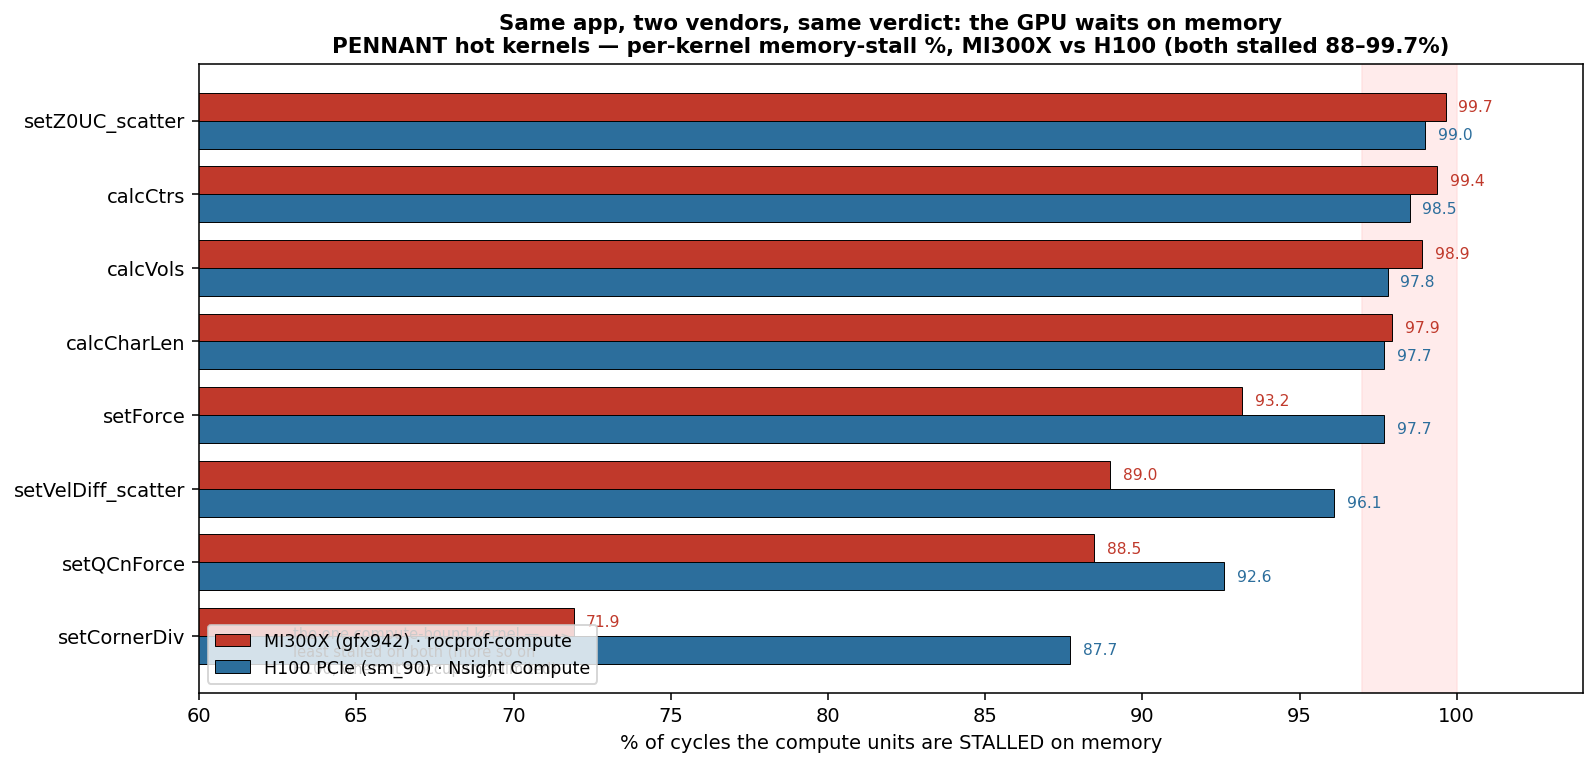
On the hot geometry and scatter kernels, both the MI300X (304 compute units
across 8 XCDs) and the H100 (114 SMs) sit 97–99.7% idle — the compute fabric
the hardware is sold for does nothing roughly 49 cycles out of 50, on either
vendor. The only kernel that meaningfully uses compute is again setCornerDiv,
and it is more stalled on the H100 (87.7% vs 71.9% on MI300X), precisely
mirroring its occupancy cliff there — MI300X's 2×-larger register file lets the
one compute-heavy kernel breathe where the H100 cannot. The headline is that the
under-use is a property of the algorithm, not the silicon: switching vendors
buys faster bytes, not busier compute. You don't fix idle compute by changing the
GPU — you fix it by moving fewer bytes.
Why compute/communication overlap can't be cashed in here
The textbook fix for transfer stalls is to overlap them — run independent
compute on the GPU while data moves on a side stream. I built exactly that: an
async path that runs setVelDiff_norm on the host concurrently with the
independent setCornerDiv → setQCnForce → setForce GPU chain (async device-to-host
on a side stream, pinned host buffer). It works — the async path beat the serial
offload at every mesh size — but it only reached break-even with the all-GPU
build at the largest mesh, never a speedup.
The stall assessment explains why, and the reason is general. Overlap hides communication behind compute: it needs a fat, independent block of compute that runs long enough to cover the transfer. This workload has no such block.
- The compute is a thin sliver — 23% of GPU-active time — and the kernels inside it are themselves 98–99.7% stalled on memory, so there is barely any busy compute to hide a transfer behind in the first place.
- The one overlappable kernel is ~0.3 ms; it can mask only a tiny slice of a transfer several times its size. The ceiling is "free offload," not acceleration.
- You cannot buy your way out with a bigger mesh: the transfer penalty is O(zones), exactly like the compute, so the ratio is scale-invariant. More zones add more compute and proportionally more bytes to move.
Compute/communication overlap is a real lever — but it only pays when there is substantial independent compute activity to overlap against. Without that reservoir, overlap's upside is capped at reclaiming idle transfer time, not adding throughput. The levers that actually move this code remove the crossings rather than hide them: full device residency (port the remaining host-resident stages so the per-cycle readbacks disappear), or an APU with unified memory (the MI300A in El Capitan — no PCIe hop to overlap at all). On a discrete, PCIe-attached GPU, the right call is to keep every stage on the device.
This is also why the binding constraint is memory movement, not arithmetic — precisely the regime a modeled memory system can capture before any hardware exists, which is where the methodology goes next.
The method is the deliverable — portable, and built to run before the silicon exists
Nothing here is vendor-specific by design. The portability spine is a single clean-room codebase that builds to CUDA, HIP, and OpenMP-target; the defaults differ per architecture (that is a finding, not a failure), but the process — roofline placement, correctness gating against a reference, and round-robin measurement to reject artifacts — is identical on every platform. Point it at a new GPU and the workflow is unchanged.
The same harness is built to reach before the hardware exists. Because the binding constraint here is memory bandwidth, the analysis that drove every decision — where each kernel lands on the roofline — needs only a modeled memory system, not silicon. The roadmap is to shim this methodology into pre-silicon architectural simulators (gem5, with McPAT for energy), so a kernel's roofline placement and the bandwidth ceiling of a not-yet-shipping architecture can be projected, with the same correctness and measurement discipline applied to simulated runs. The groundwork is already in the companion gem5 investigations — cache size and energy and memory bandwidth and parallelism. What carries forward is not a number on one vendor's box; it is a method that ports across vendors and forward into simulation.
Why it matters for clients
Performance claims are only as good as the baseline behind them and the methodology that produced them. Organizations buying accelerators need four things this campaign demonstrates: a predicted speedup rather than a hoped one; the crossover that tells them when the accelerator actually beats their current server; per-architecture builds, because the fastest configuration genuinely differs between NVIDIA and AMD; and results that survive scrutiny — gated for correctness and re-measured for artifacts, because a physics gate cannot catch a measurement error.
The deliverables are directly reusable: a clean-room multi-backend port that
builds for CUDA, HIP, and OpenMP-target from one source tree; a reproducible
cloud-GPU benchmarking workflow; per-architecture roofline data and the
build-system archive of the fastest per-architecture flags; and a cross-vendor
portability write-up (including a genuinely nasty double2 ABI mismatch between
the host and HIP device compilers). PENNANT is the demonstration vehicle; the
method transfers to a client's solver, on their hardware, at their accuracy bar.
When a number is going to drive a hardware decision, SVAC delivers the number
and the conditions under which it holds.
Source, per-architecture data, and the capability deck are linked below.
Further reading — the shoulders this stands on
This methodology owns none of its foundations; the contribution is the disciplined way to combine, verify, and teach them. Credit where it is due:
- The portability metric — S. J. Pennycook, J. D. Sewall, V. W. Lee, A Metric for Performance Portability (arXiv:1611.07409, 2016), and Implications of a Metric for Performance Portability (Future Generation Computer Systems, 2019). The Φ score used here is theirs.
- The performance model — S. Williams, A. Waterman, D. Patterson, Roofline: An Insightful Visual Performance Model for Multicore Architectures (Communications of the ACM, 2009). The predict-then-check discipline rests on it.
- Single-source portability frameworks — Kokkos, RAJA, SYCL, and OpenMP target offload — the production paths to the same goal. This study uses raw CUDA/HIP/OpenMP-target to keep the method visible, not to compete with them.
- Cross-vendor portability tracking — T. Deakin et al., Tracking Performance Portability on the Yellow Brick Road to Exascale (P3HPC, 2020); BabelStream.
- The benchmark — C. R. Ferenbaugh, PENNANT: An Unstructured Mesh Mini-App (Concurrency and Computation, 2015); the CORAL-2 suite (El Capitan procurement).