Engineering the GPU Win
A roofline-driven, multi-vendor optimization campaign
on an exascale-acceptance benchmark
PENNANT Lagrangian hydrodynamics · NVIDIA T4 / H100 · AMD MI300X
CUDA · HIP · OpenMP-target — one clean-room codebase
Srinath Vadlamani · SV Advanced Computing LLC
What the LLC does
- Roofline-driven GPU performance engineering — measure the ceiling first, then chase it
- Vendor-agnostic: CUDA, HIP/ROCm, OpenMP-target — the same code on NVIDIA and AMD
- Honest benchmarking: we publish the negative result and the crossover, not just the headline
- Measurement discipline that catches its own artifacts
Proven on a deliberately hard target:
PENNANT — CORAL-2 / El Capitan
  acceptance mini-app
3 architectures · 9 phases
self-funded · rented GPUs
clean-room BSD portThe target: a benchmark built to be hard
PENNANT — unstructured-mesh Lagrangian hydro, part of CORAL-2, the suite used to accept El Capitan (~2 EF, LLNL).
- Sides-indexed mesh — the loop body reaches points / zones / edges through indirection maps
- Scatter atomics are unavoidable — many sides → one zone, every reduction is an
atomicAdd - Low arithmetic intensity — bytes per FLOP is high; this is a bandwidth problem
for side s:
  p1,p2 = mapsp1[s], mapsp2[s]
  z     = mapsz[s]
  e     = mapse[s]
  ...
  atomicAdd(&zone[z], contribution)
       ^ irregular, contended
Exactly the access pattern GPUs are worst at.
Method: measure the ceiling, then earn it
- Roofline first — empirical HBM & FLOP ceilings per GPU; know the speed of light before optimizing
- Two-filter porting — time-domain (what's hot) × roofline (what can move)
- Validate every phase — a regression gate (energy + full field) blocks any change that breaks physics
- One variable at a time — sweep, attribute, keep or revert
9 tagged phases, each gated:
 01 per-call kernels
 ...
 07 H100 verify   (17.2×)
 08 launch-config + hybrid CPU
 09 compilation variants
The roofline is the strategy
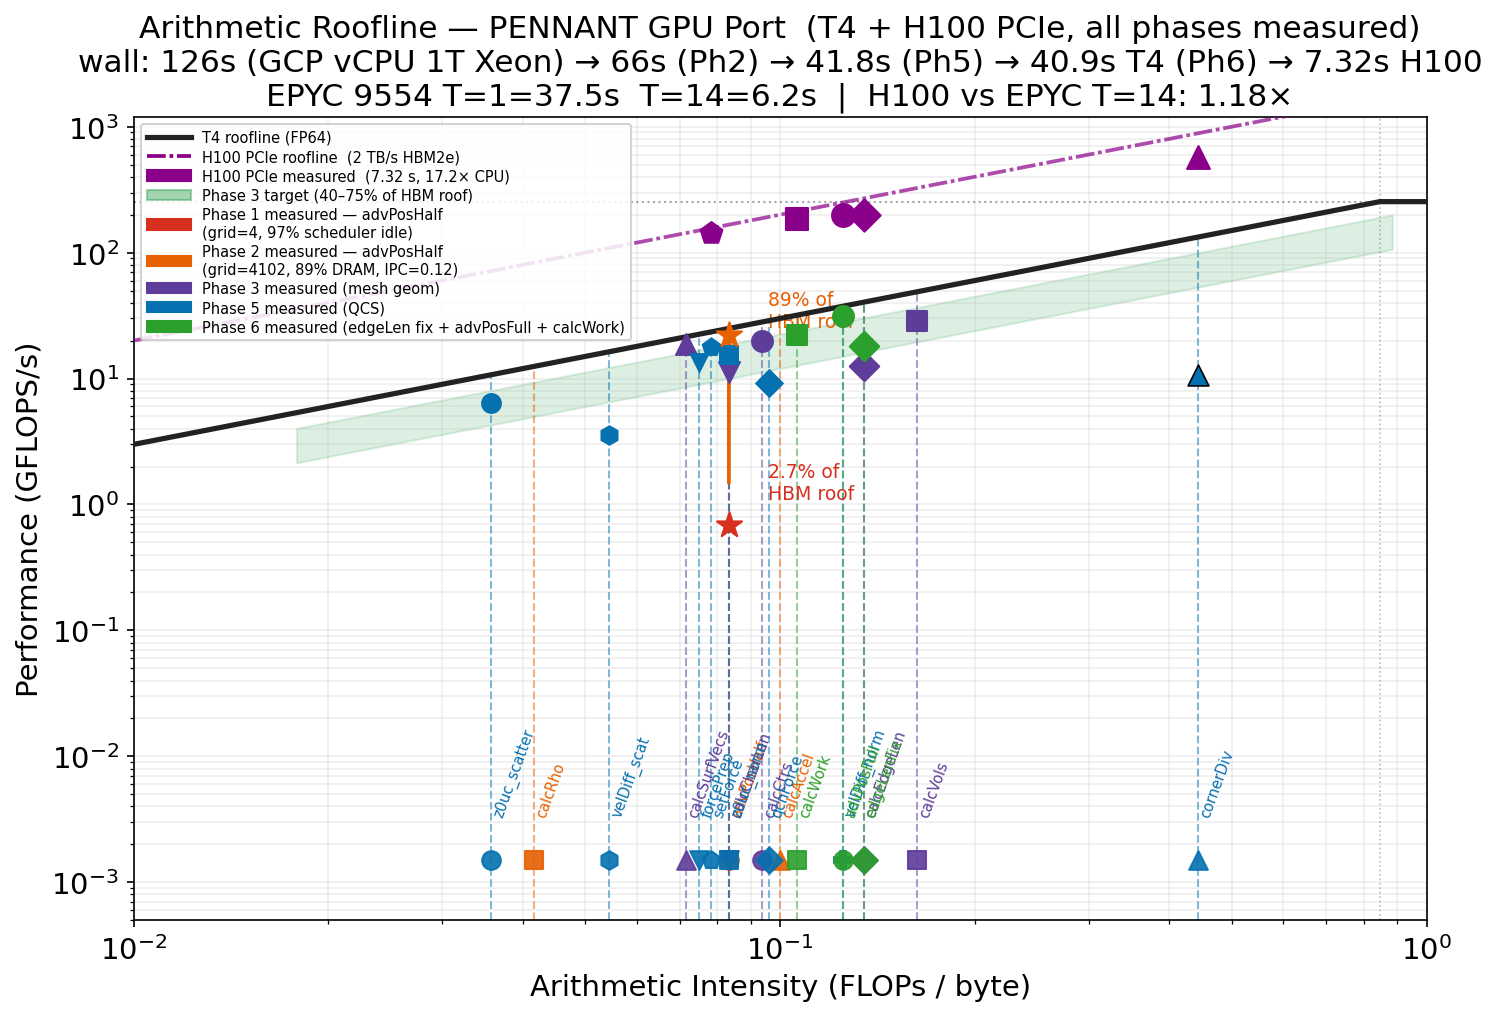
Every PENNANT kernel sits far left of the ridge — pinned to the sloped bandwidth ceiling, nowhere near the flat compute ceiling. That single picture predicts the entire campaign: compute and occupancy levers can't help; only bandwidth and traffic reduction can.
The same picture on every vendor
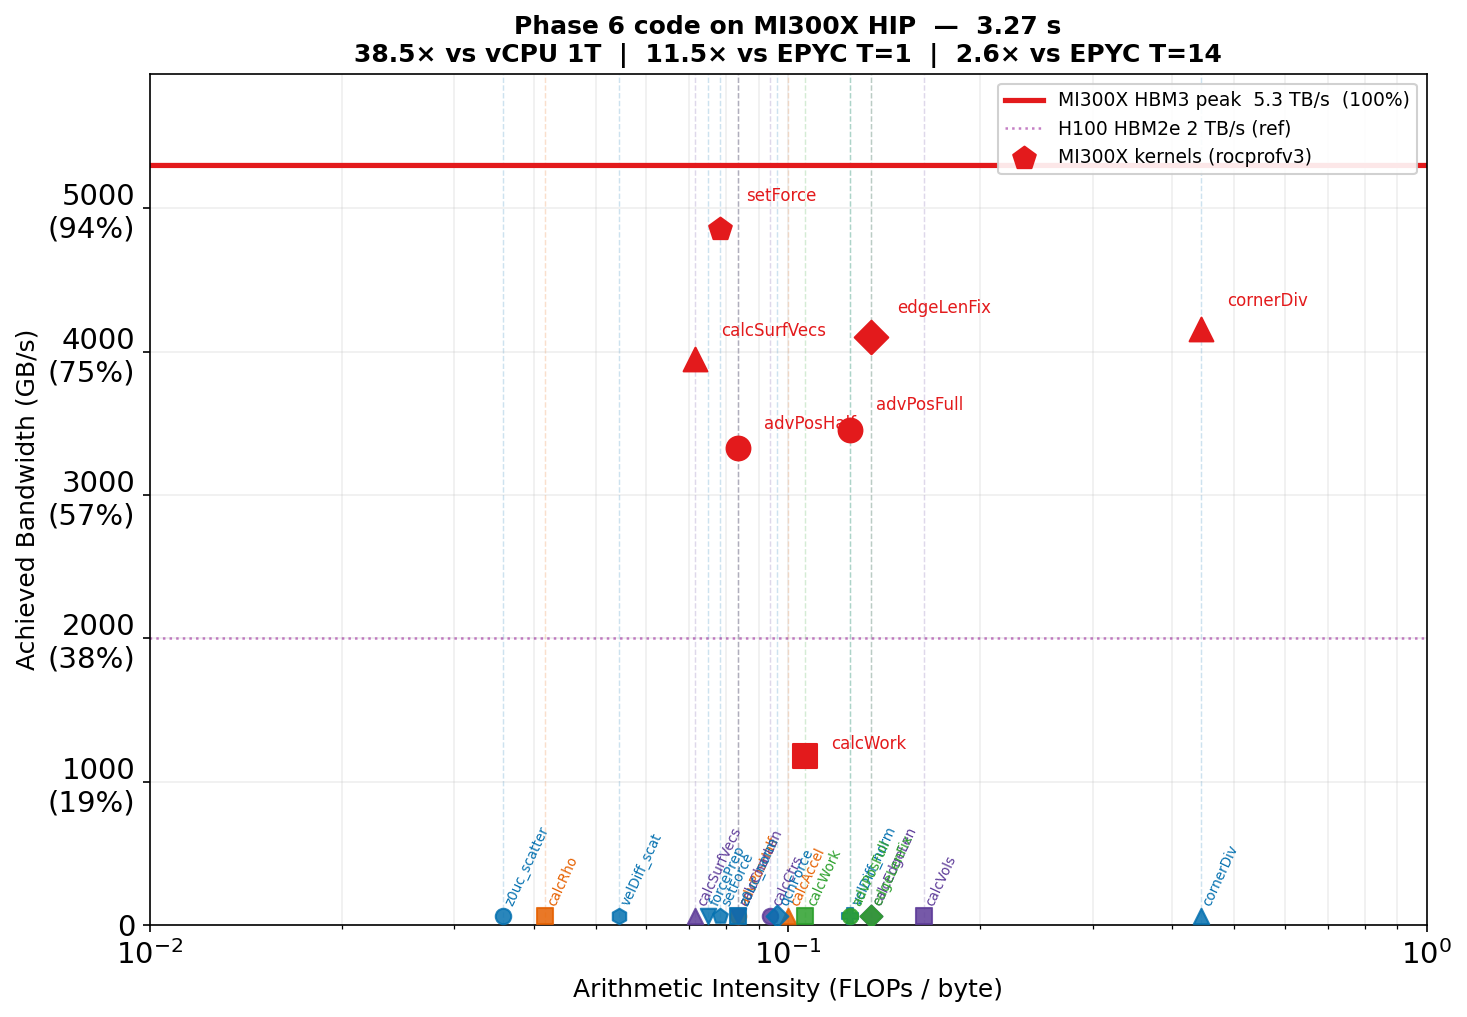
MI300X (HBM3, 5.3 TB/s peak). Named kernels — cornerDiv, setForce, calcSurfVecs — plotted against the measured ceiling.
- Same diagnosis as T4 / H100: bandwidth-bound
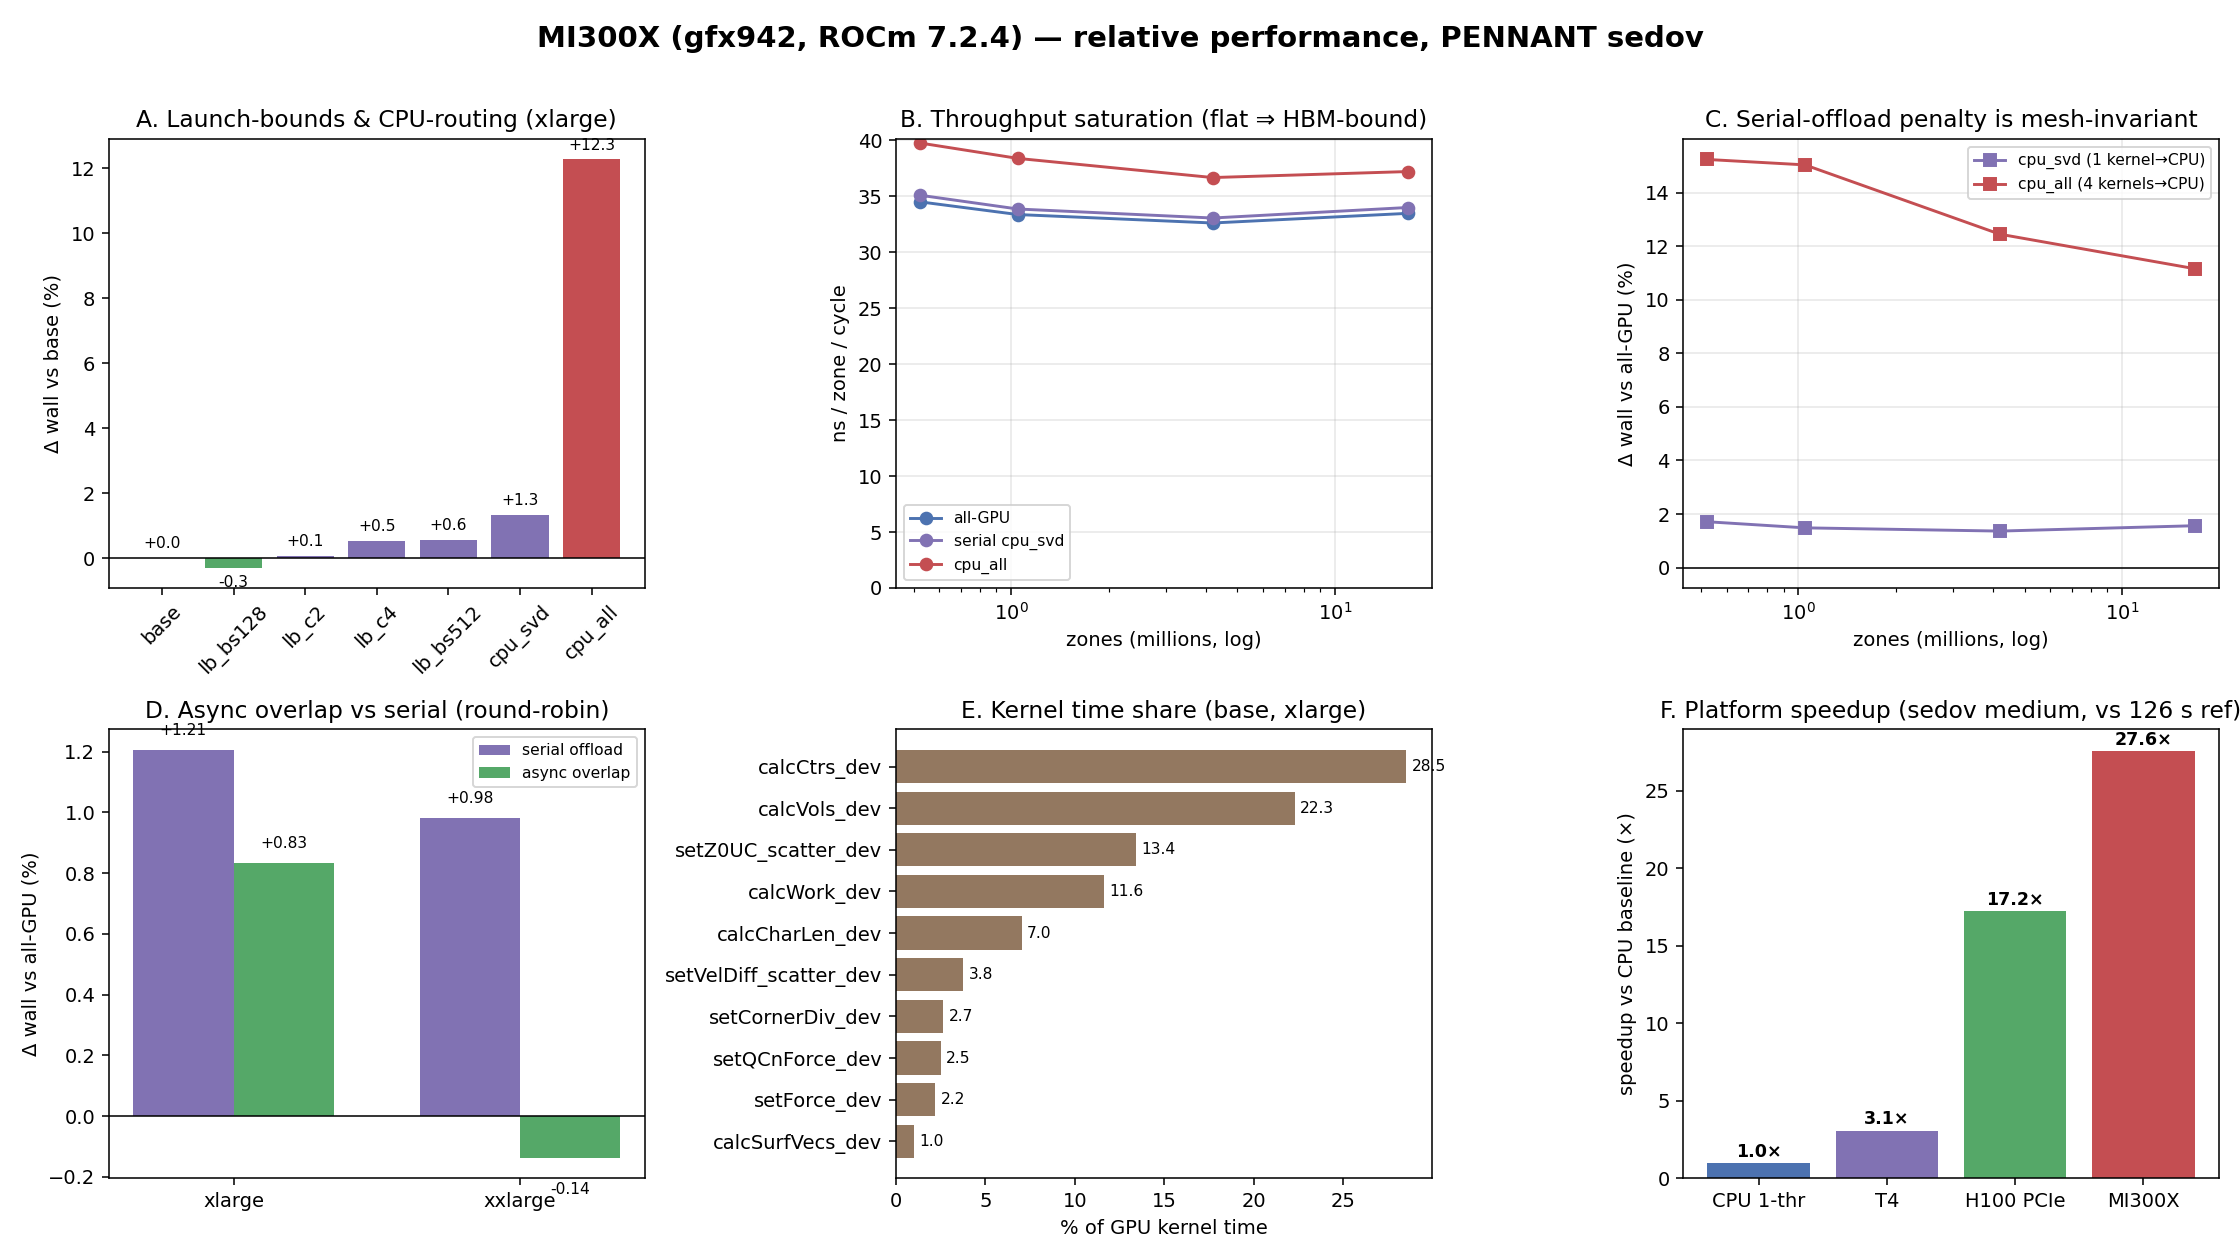
- So the speedup should scale with HBM bandwidth — and it does, to within ~2% across all three GPUs
- The roofline is a predictive model, not a post-hoc diagram
The honest number behind the headline
~2M zones
the crossover. Only above this does the GPU beat a real 14-core EPYC server. Below it, the CPU wins.
- "38.5× vs one CPU thread" is the easy, flattering baseline
- vs a competent CPU server, the GPU only pays off past a problem-size threshold
- We publish the crossover — clients need to know when the accelerator is worth it, not just that it can be
Phase 8 — launch configuration is free performance
One launch-configuration change — zero kernel arithmetic touched:
2.7% → 89%
DRAM throughput on the hot kernel
- occupancy / register / launch-bounds profiling (Nsight + rocprof)
- per-arch: H100's
setCornerDivis occupancy-limited (34%); MI300X's isn't (100%, 2× register file)
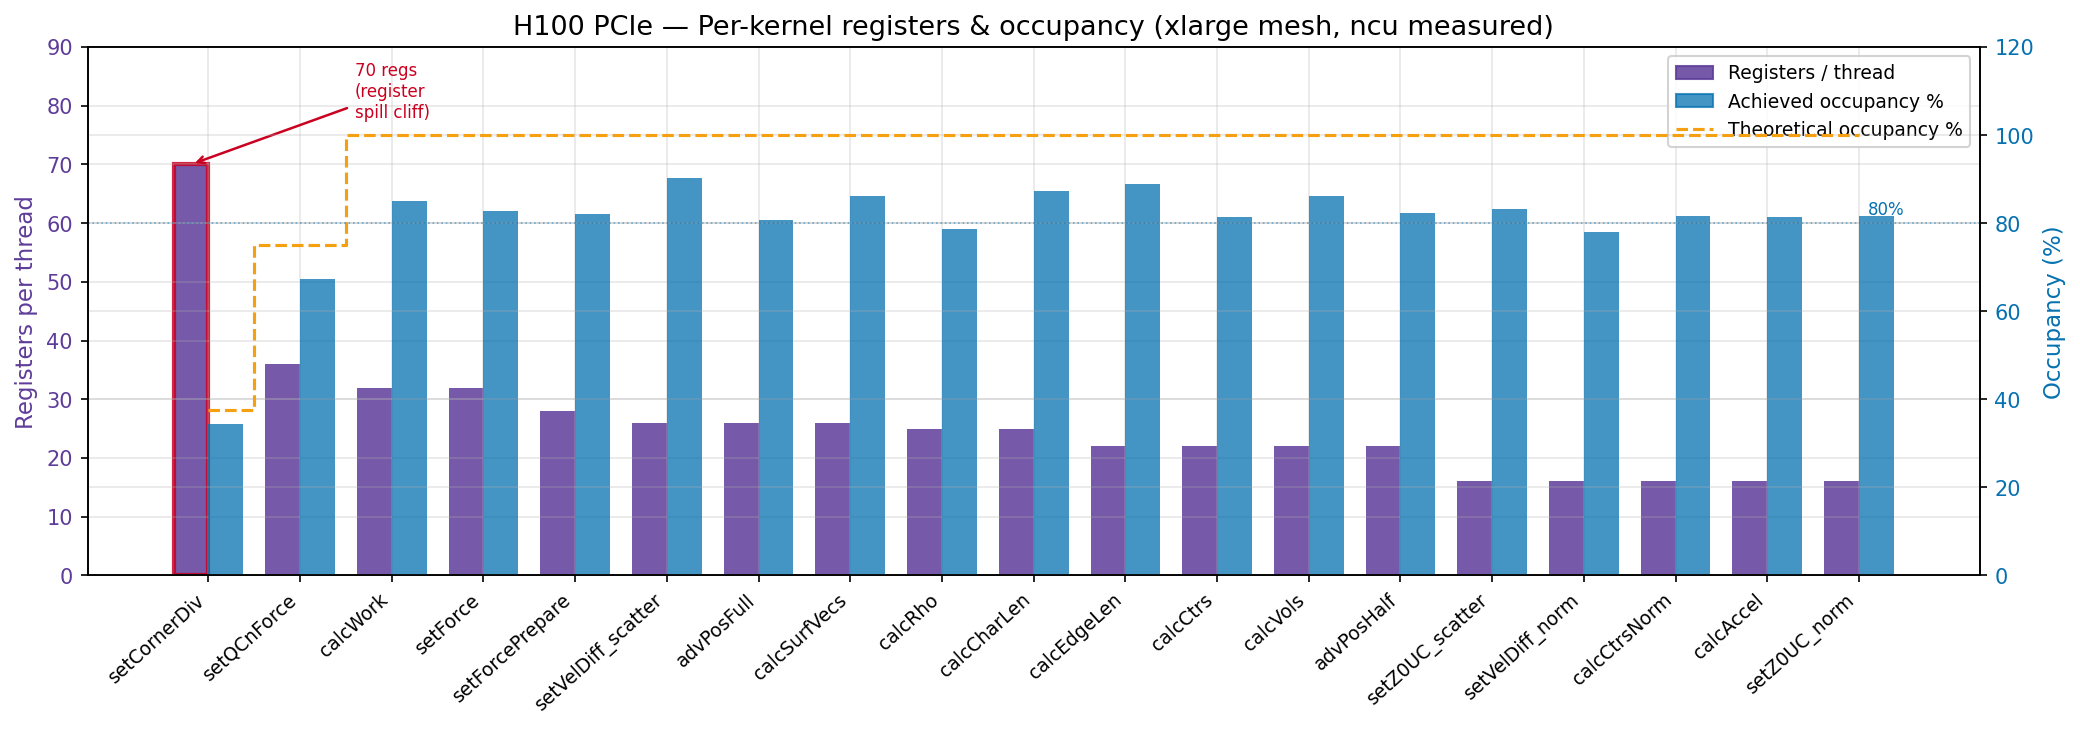
Per-arch tuning is mandatory — a sign flip
Routing one zone-kernel to the CPU (hybrid dispatch). The same flag helps on one GPU and hurts on the other:
| Config | H100 PCIe | MI300X |
|---|---|---|
SETVELDIFFNORM → CPU | −21% (preferred) | +1.3% (avoid) |
| all four zone-kernels → CPU | mixed | +12.3% |
H100 is host/PCIe-coupled — offloading hides transfer. MI300X is HBM-saturated and resident — offloading just adds traffic. The fastest build differs per architecture; we ship per-arch defaults.
Phase 9 — knowing when not to flip a flag
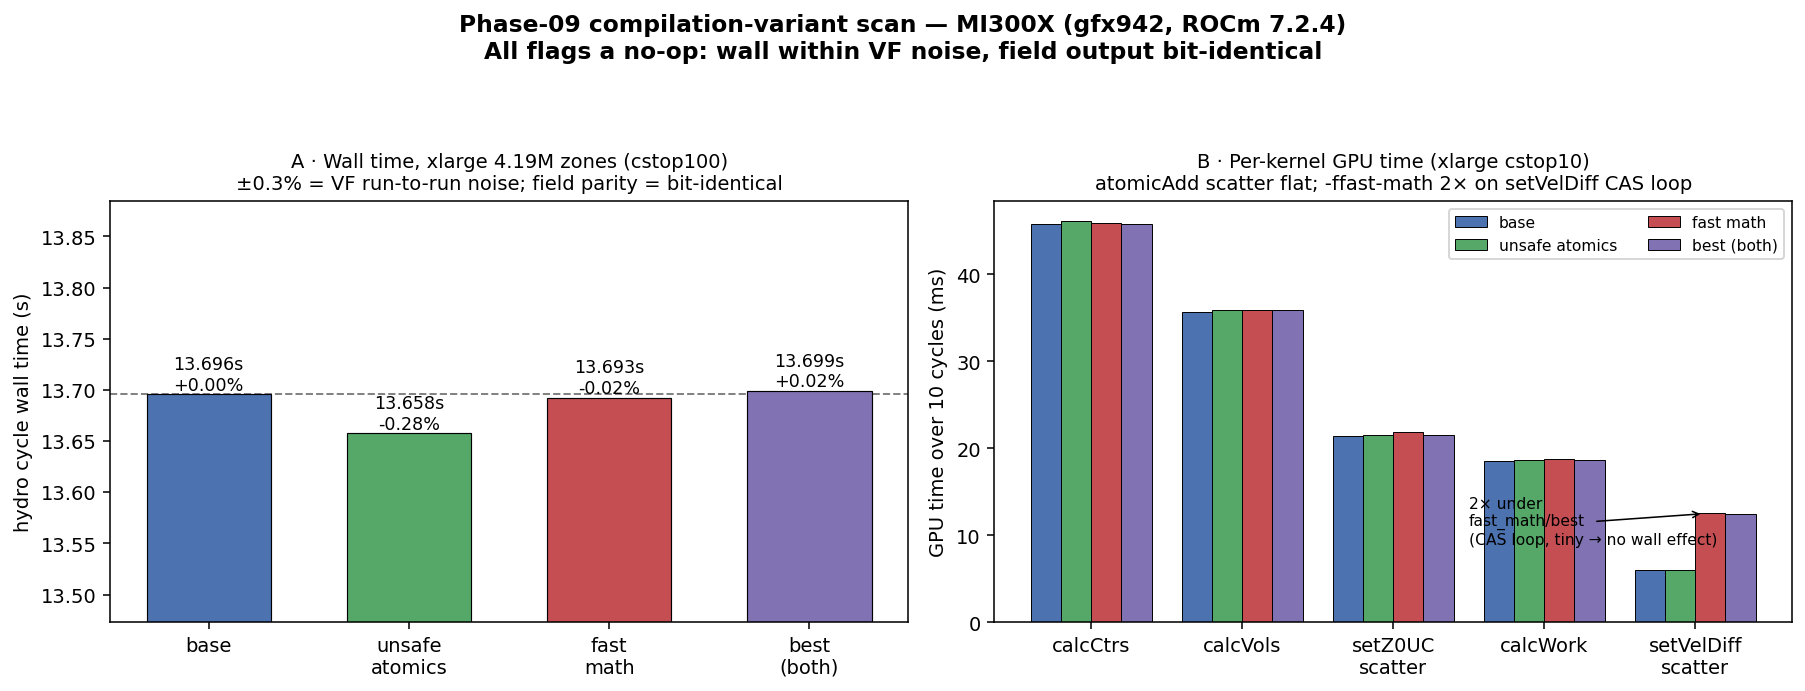
MI300X: fast-math, unsafe-fp-atomics — every compiler flag a no-op, bit-identical output. The "primary lever" did nothing because ROCm already emits the hardware f64 atomic by default. We proved the ceiling was already reached — and saved the client from a placebo flag.
Phase 9 on H100 — a 6.9% "win" that wasn't
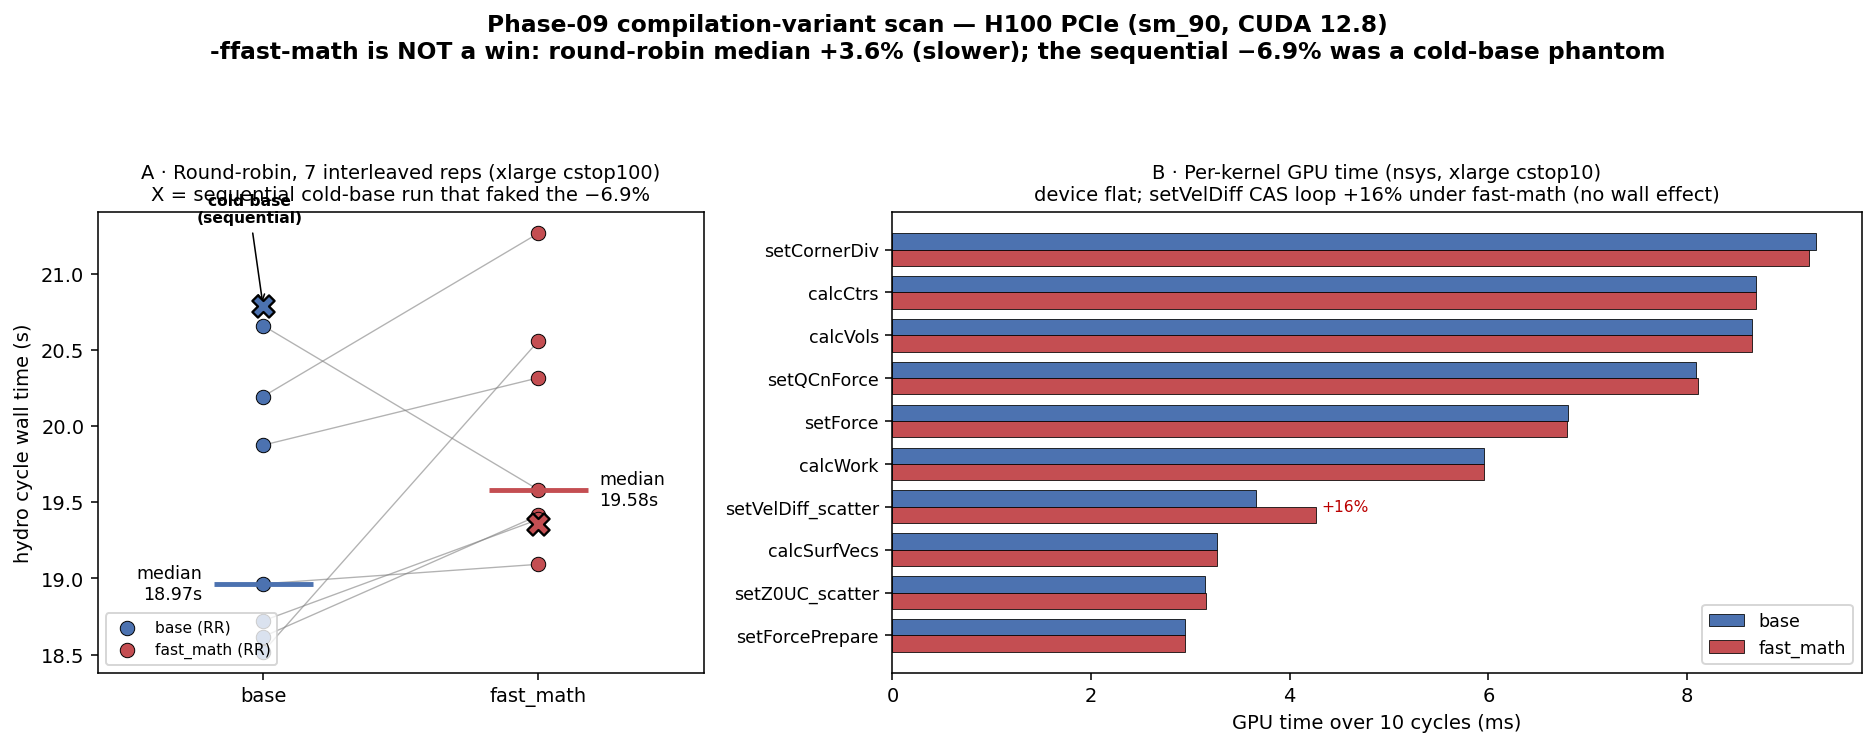
A single sequential A/B showed fast-math −6.9%. The per-kernel trace said the GPU was flat — so the win had no device source. A round-robin re-measure erased it: +3.6% slower. The −6.9% was a cold-base phantom — the first run on a fresh box runs slow.
The discipline that catches the artifact
- The phantom was large (−6.9%), directional, and survived a bit-identical correctness check
- Correctness gates can't catch a measurement error — only repeated, interleaved timing can
- The tell: a wall-time delta with no matching device delta
- Cost of the check: ~3 minutes of GPU time vs a published wrong number
cold A/B:   fast-math −6.9%  ✗ phantom
round-robin: fast-math +3.6%  ✓ truth

rule: cloud-GPU wall-time A/B
      MUST be round-robin
(sequential = cold vs warm)One codebase, three vendors, two profilers
- Backends: CUDA · HIP/ROCm · OpenMP-target — selected at build, one source tree
- Silicon: T4 (sm_75) · H100 (sm_90) · MI300X (gfx942)
- Tooling: Nsight Compute · rocprof / rocprof-compute · empirical rooflines
- Clean-room: BSD-licensed, IP-disciplined, fully reproducible
Modern workflow: AI-assisted, human-verified
- The campaign was driven with AI-assisted development — design docs, kernel ports, sweep harnesses, plots
- Every result gated by measurement — the AI proposes, the regression suite and the profiler decide
- The phantom catch happened inside this loop — the discipline is the guardrail on the speed
propose  → AI design + code
gate     → regression (physics)
measure  → roofline + profiler
verify   → round-robin timing
keep / revertWhat this means for a client
- A predicted speedup, not a hoped one — roofline-anchored, within ~2% across vendors
- The crossover — exactly when your accelerator beats your current server, so the spend is justified
- Per-architecture builds — the fastest config on each target, because they genuinely differ
- Results you can trust — gated for correctness, re-measured for artifacts, reproducible end to end
The same method transfers to your solver, on your hardware, at your accuracy bar.
Engineering the GPU win
Roofline-driven · multi-vendor · honestly measured
T4 3.08×   ·   H100 17.2×   ·   MI300X 27.6×
roofline-predicted to ~2%  ·  crossover ~2M zones
9 phases, every one gated  ·  the phantom, caught
SV Advanced Computing LLC
codeberg.org/srinathv/pennant-gpu